Using Graphs & Geometry 87
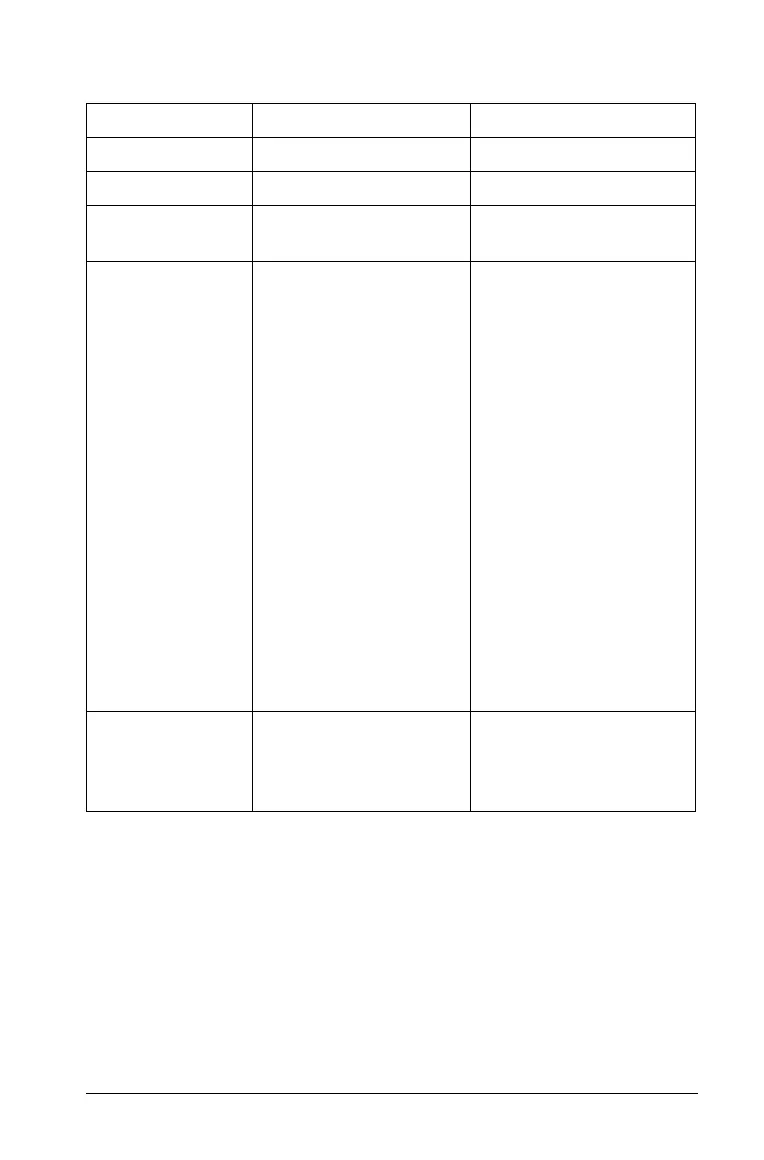
Summary of differences
Creating and manipulating axes
When you add the Graphs & Geometry application to a page, Cartesian
axes displays by default.
You can change the appearance of your axes in the following ways:
1. Adjust the length of the axes:
• When using Plane Geometry mode with Show Analytic Window,
– Select an axis and retype the domain or range labels.
Feature Graph Area Plane Geometry Area
Aspect Ratio Adjustable; initially 1:1 Always 1:1 (static)
Units of Measure Generic (displayed as u) User-defined (per scale)
Area Graph Type Cartesian (default) or
Polar
Euclidian
Uses • Define and graph
functions to:
– Graph
functions of
the form f (x)
– Create scatter
plots
– Graph polar
equations
– Graph
parametric
functions
• Construct analytic
objects
• Label equations
• Identify
coordinates for
discrete points
• Construct Euclidean
objects
• Create
transformations
•Determine
measurements (e.g.,
length, angle, area)
Behavior Analytic constructions
must remain in the
analytic area.
Geometric constructions
can be moved into the
analytic area but remain
geometric in nature.

 Loading...


