Using Graphs & Geometry 169
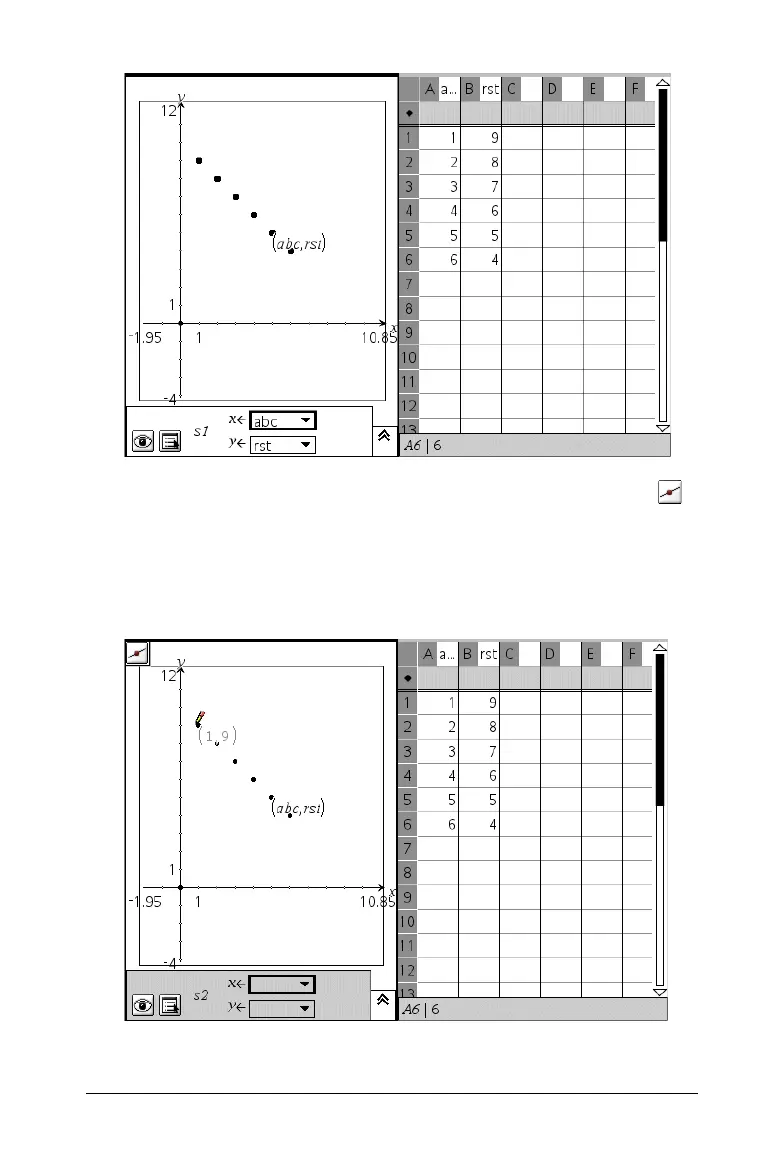
5. To label the points on the scatter plot, select the Point On tool ( )
from the Points & Lines menu.
a) Select the first point.
The coordinates display.
b) Click to anchor the values on the work area.
c) To label the remaining points, select them one at a time.

 Loading...


