170 Using Graphs & Geometry
Click each one to anchor the coordinates on the work area.
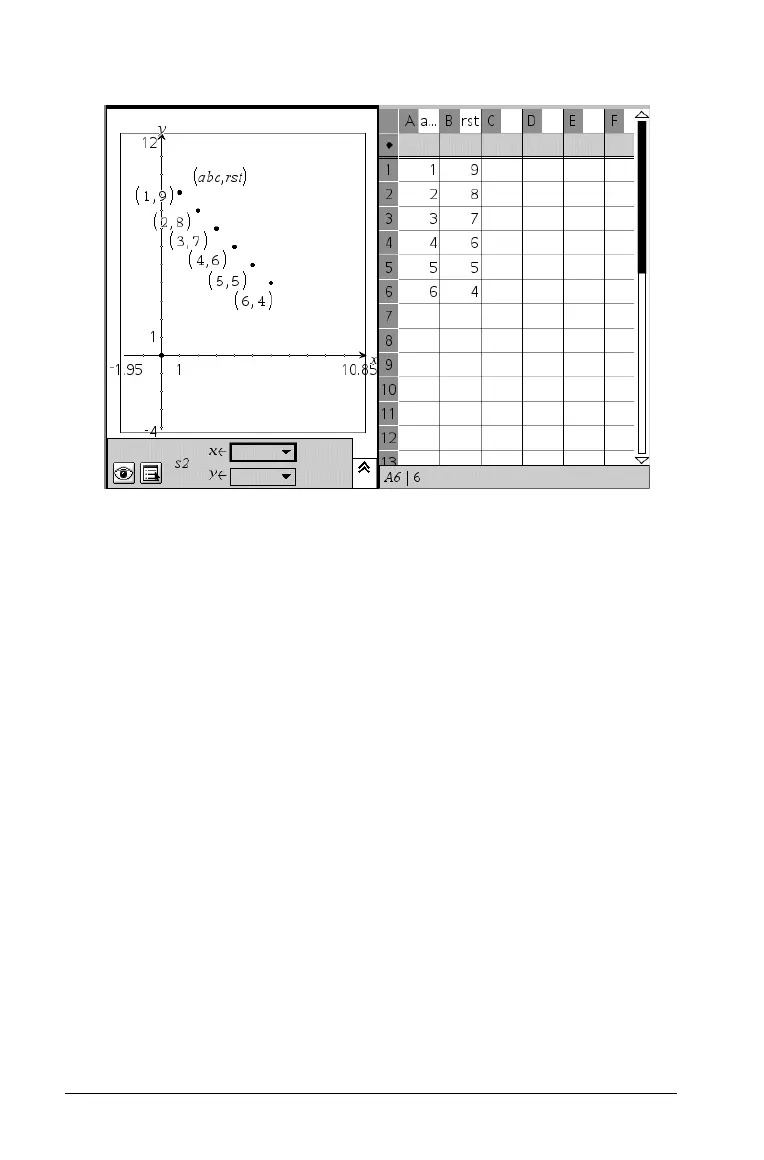
6. Label the axes and significant points, if desired.
Note: If you have plotted more than one set of data, notice that each
plot has a different point style.
You can use Graphs & Geometry to examine the differences between
points in one data set or between two or more sets by determining the
slope between points, comparing min and max points, and/or calculating
overall change over elapsed time.

 Loading...


