252 Using Data & Statistics
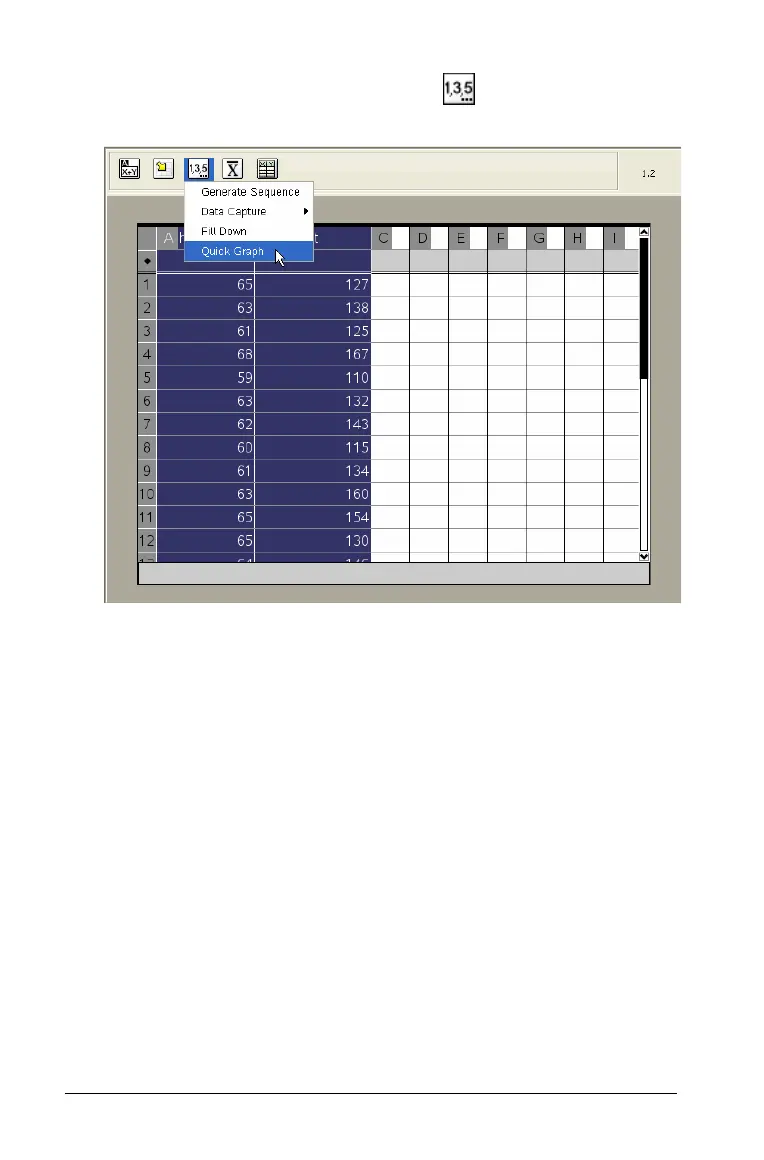
3. From the Lists & Spreadsheet Data menu , select the Quick Graph
tool.
The data plot displays in the Data & Statistics work area.
The example below illustrates the plot of two columns of data,
which display as a scatter plot. The leftmost column of data in the
spreadsheet becomes the horizontal axis values, and that column
name becomes the horizontal axis label.

 Loading...


