Using Lists & Spreadsheet 203
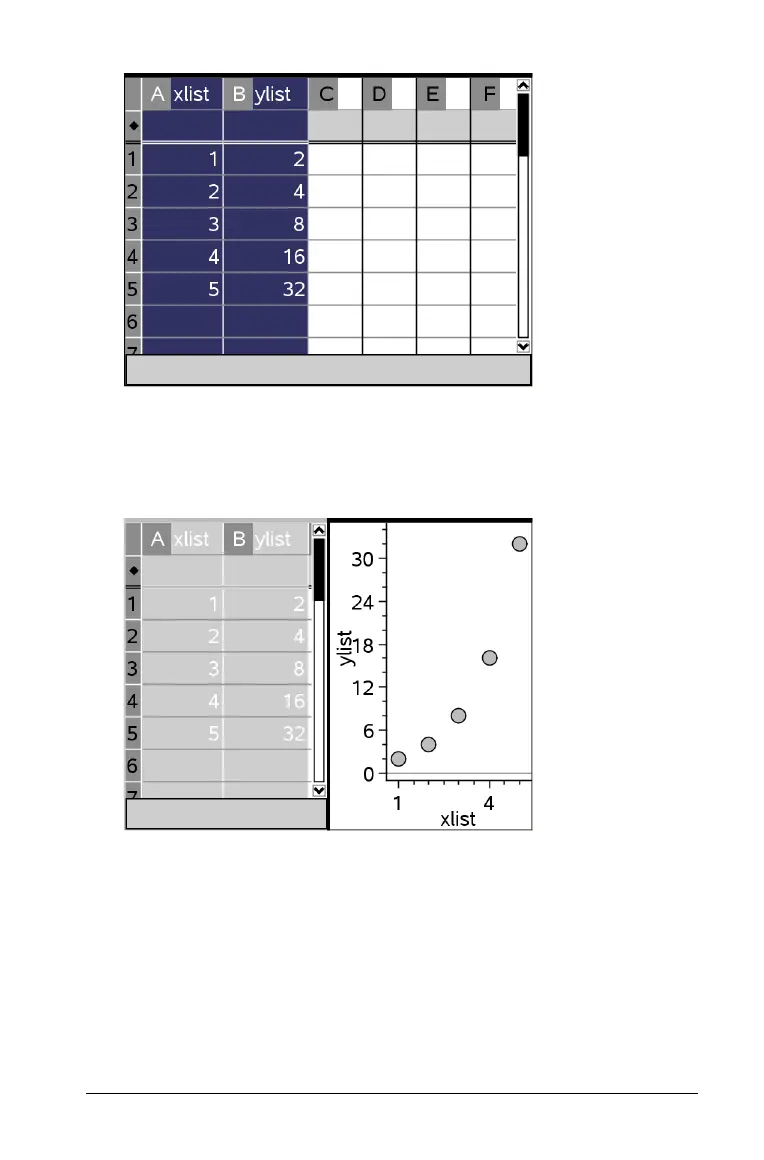
3. On the Data menu, select Quick Graph.
A Data & Statistics work space is added to the page and shows the
plotted data. The leftmost of the two lists is plotted on the x axis,
and the other list is plotted on the y axis.
4. (Optional) Use the Data & Statistics features to analyze or visually
enhance the graph.
Note: Refer to Using Data and Statistics for information about
analyzing and exploring graphs.

 Loading...


