174 Using Lists & Spreadsheet
Data Capture Allows manual or automatic
capture of variable data from
Graphs & Geometry, Calculator,
Data & Statistics, or within Lists &
Spreadsheets. Use
Ctrl . (period)
to trigger each manual capture.
Fill Down Lets you duplicate the contents of
a selected cell or group of cells
within a column.
Quick Graph Uses the Data & Statistics
application to graph one or two
selected columns of data as a dot
plot or scatter plot.
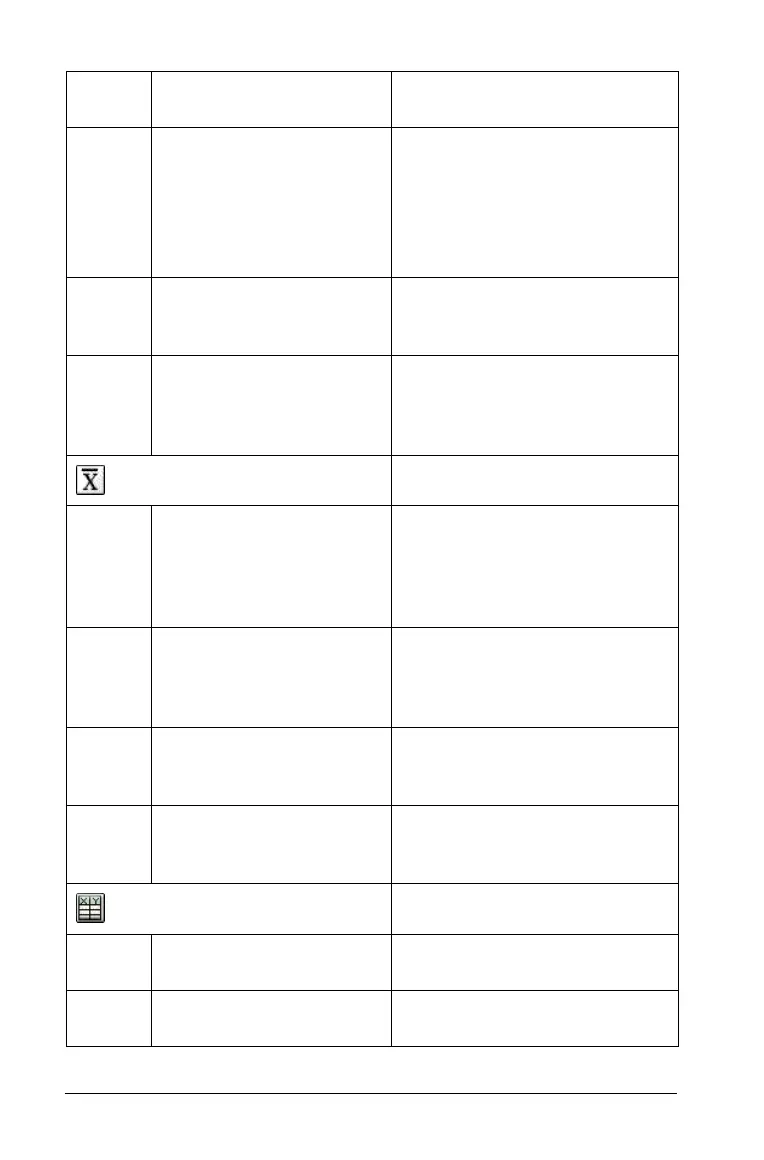
Statistics
Stat Calculations Lets you select from several
statistics calculations, such as
one-variable analysis, two-
variable analysis, and
regressions.
Distributions Lets you calculate and plot
several distributions, such as
Normal Pdf, Binomial Cdf, and
Inverse F.
Confidence Intervals Lets you calculate several
confidence intervals, such as
tinterval and zinterval.
Stat Tests Lets you perform and plot several
hypothesis tests such as
t test, z
test
, and ANOVA.
Function Table
Switch to Function Table
(Ctrl T)
Toggles the function table view.
Select Function Lets you select a different
function for the current column.
Menu
Name
Menu Option Function

 Loading...


