EasyManuals Logo

Texas Instruments TI-Nspire Software Guide

Texas Instruments TI-Nspire
380 pages
To Next Page IconTo Next Page
To Previous Page IconTo Previous Page
Page #227 background imageLoading...
Page #227 background image
Using Lists & Spreadsheet 215
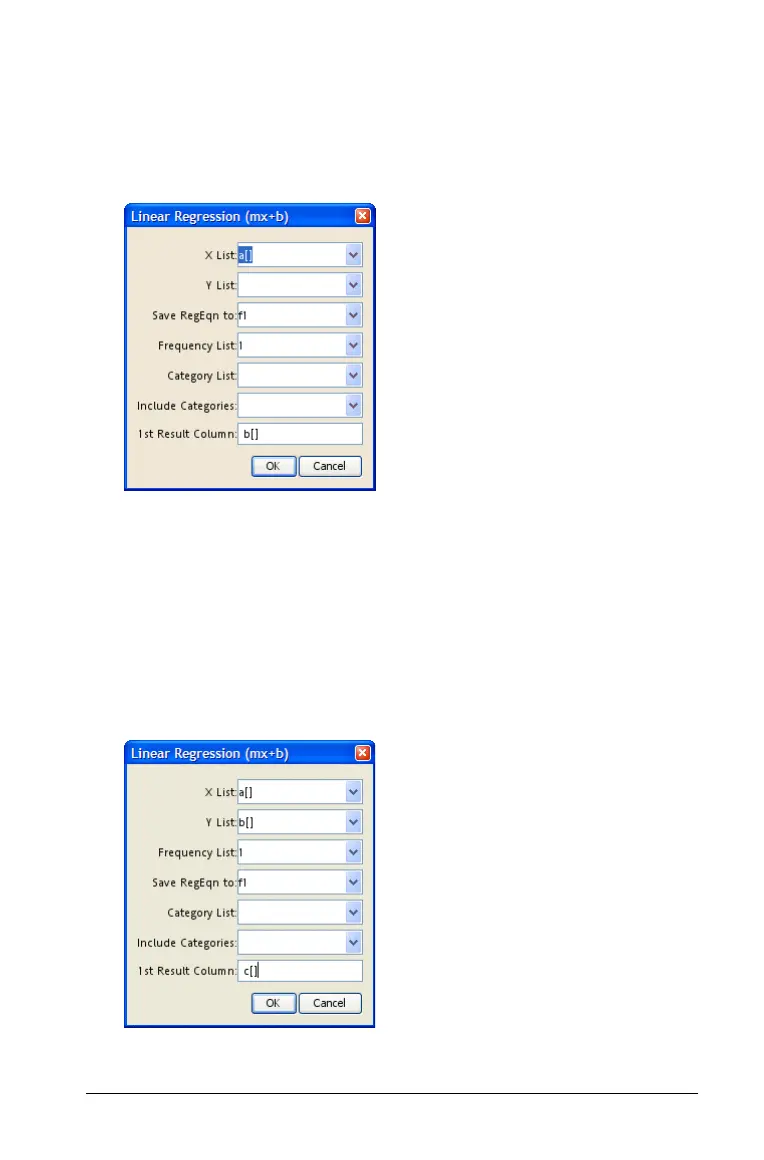
2. On the Statistics menu, select Stat Calculation, and select Linear
Regression (mx+b)
to choose the regression model.
A wizard opens, giving you a labeled box to type each argument.
Because you selected a cell in advance, the column for X List is
already filled in.
3. Press
Tab to move to the Y List box, or click the drop-down arrow to
select a named list.
4. Type b[] to specify the values in column B as Y List.
5. If you want to store the regression equation in a specified variable,
press
Tab, and then replace Save RegEqn To with the name of the
variable.
6. Press Tab as necessary to move to the 1st Result box.
7. Type
c[] as the column letter for the first result column.
8. Select OK.

Table of Contents

Other manuals for Texas Instruments TI-Nspire

Questions and Answers:

Question and Answer IconNeed help?

Do you have a question about the Texas Instruments TI-Nspire and is the answer not in the manual?

Texas Instruments TI-Nspire Specifications

General IconGeneral
TypeDisplay
Form factorPocket
Product colorBlue, White
Display resolution320 x 240 pixels
Display size (HxV) (imperial)0 \
Compatible operating systemsWindows Vista/XP Mac OS X 10.4/10.5
Battery typeAAA
Number of batteries supported4
Weight and Dimensions IconWeight and Dimensions
Dimensions (WxDxH)100 x 198.3 x 28.7 mm

Related product manuals