222 Using Lists & Spreadsheet
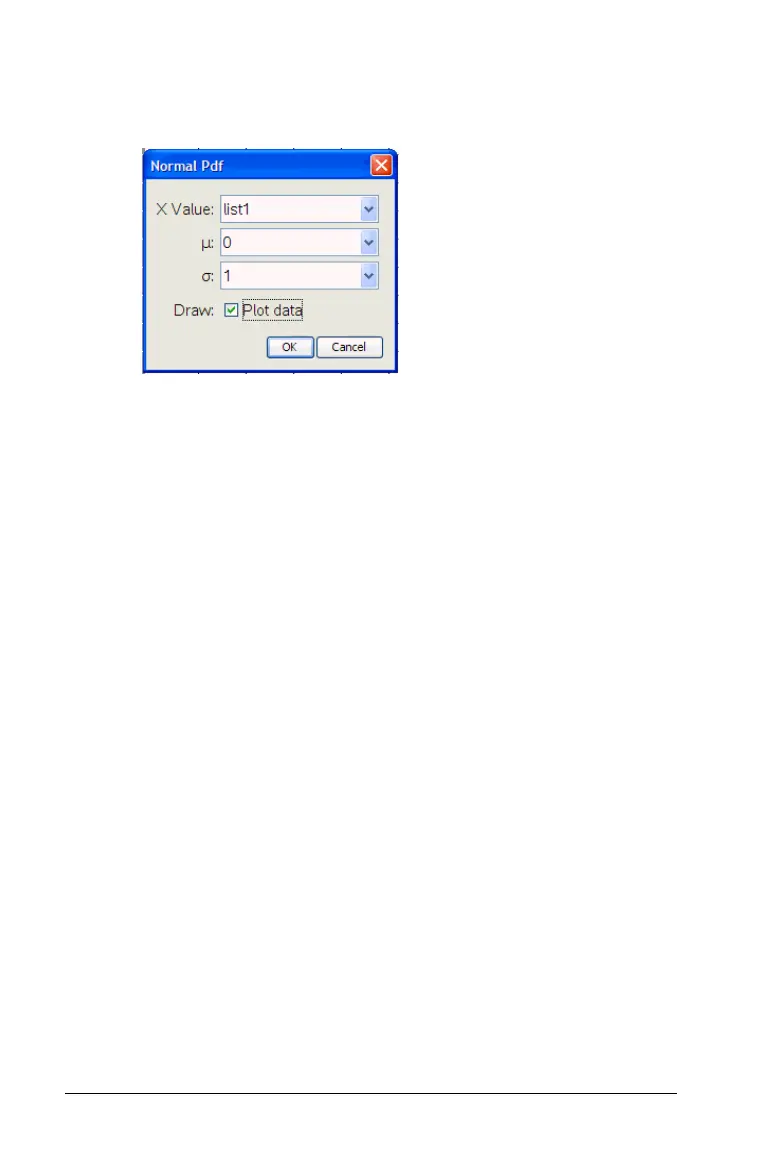
A wizard opens, giving you a labeled box to type each argument.
You can type values, or select them from the drop down selection
list.
3. Press
Tab as necessary to complete each argument.
4. Click the Draw check box, to see the distribution plotted in Data &
Statistics.
Note: The Draw option is not available for all distributions.
5. Select OK.
Lists & Spreadsheet inserts two columns: one containing the names
of the results, and one containing the corresponding values. The
results are plotted in Data & Statistics.

 Loading...


