Using Data & Statistics 255
1. Insert a new page, and create a split page layout with Lists &
Spreadsheets and Data & Statistics.
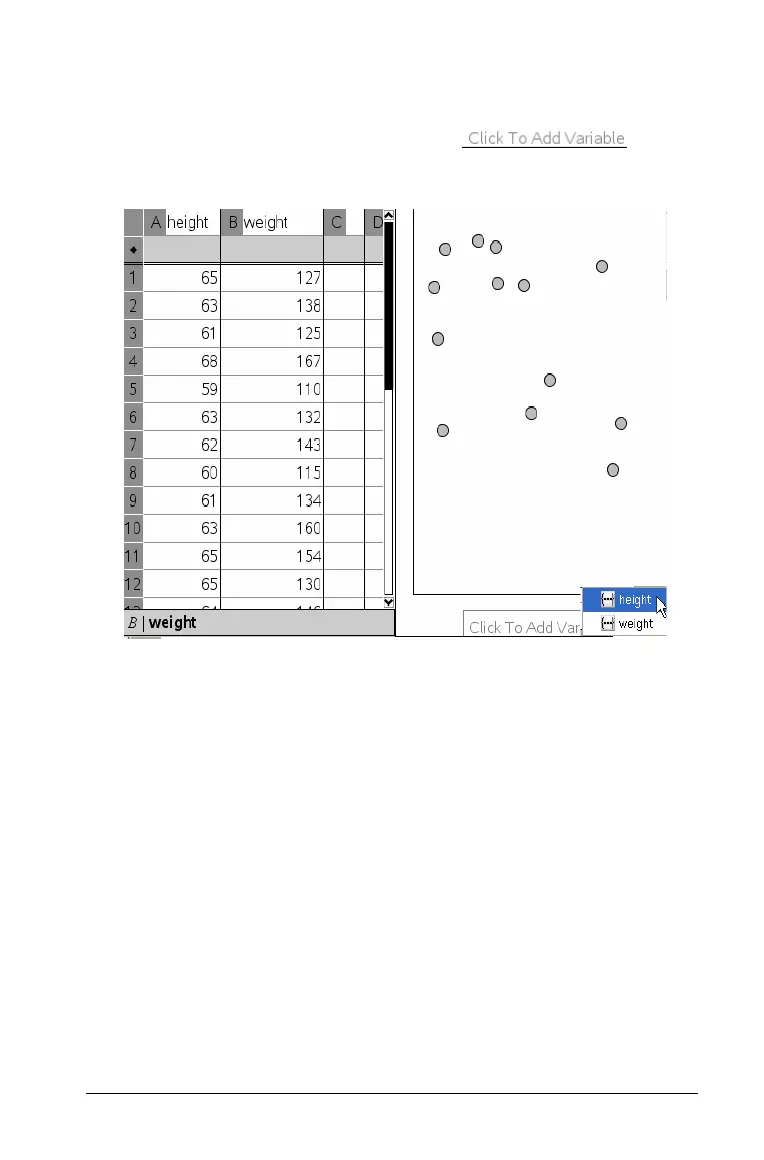
2. On the Data & Statistics work area, click and
select the name of the data set you want to plot on the horizontal
axis.
The example below illustrates the value of the column named
height plotted on the horizontal axis of the Data & Statistics work
area.

 Loading...


