Using Data & Statistics 267
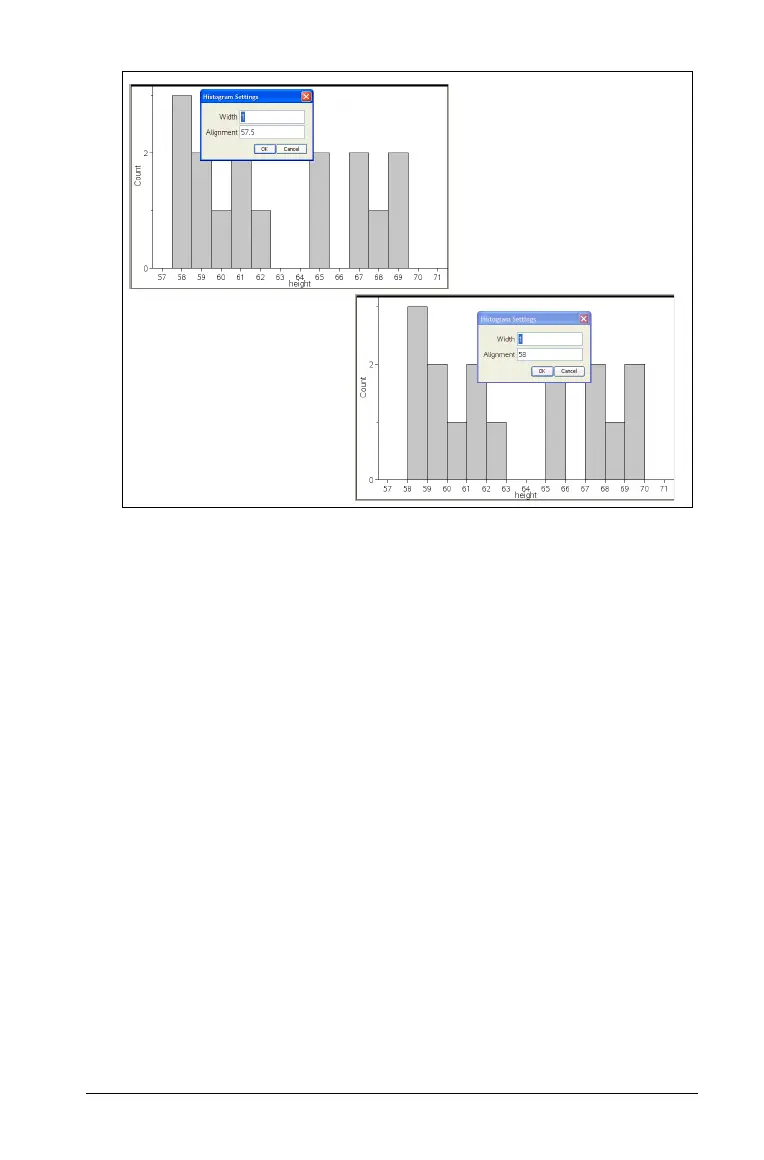
For example, when a histogram with a bin width of 1 is centered
over the tic marks on the axis with the default alignment of 57.5,
changing the alignment to 58 right aligns all bins on the axis scale.
All bins are shifted right by .5; the offset for positioning bins on the
axis is based on the starting position for the data and the value you
specify for alignment.
Changing the properties of a histogram:
Use the histogram properties tools to change the data representation
format in a histogram. The options for properties are:
• Count - displays data based upon the number of values that occur
within each bar (interval or bin) on the histogram. This is the default
data representation when you create a histogram.
Default bin alignment
(centered on tic mark)
Bin alignment increased
(right aligned on tic mark)

 Loading...


