270 Using Data & Statistics
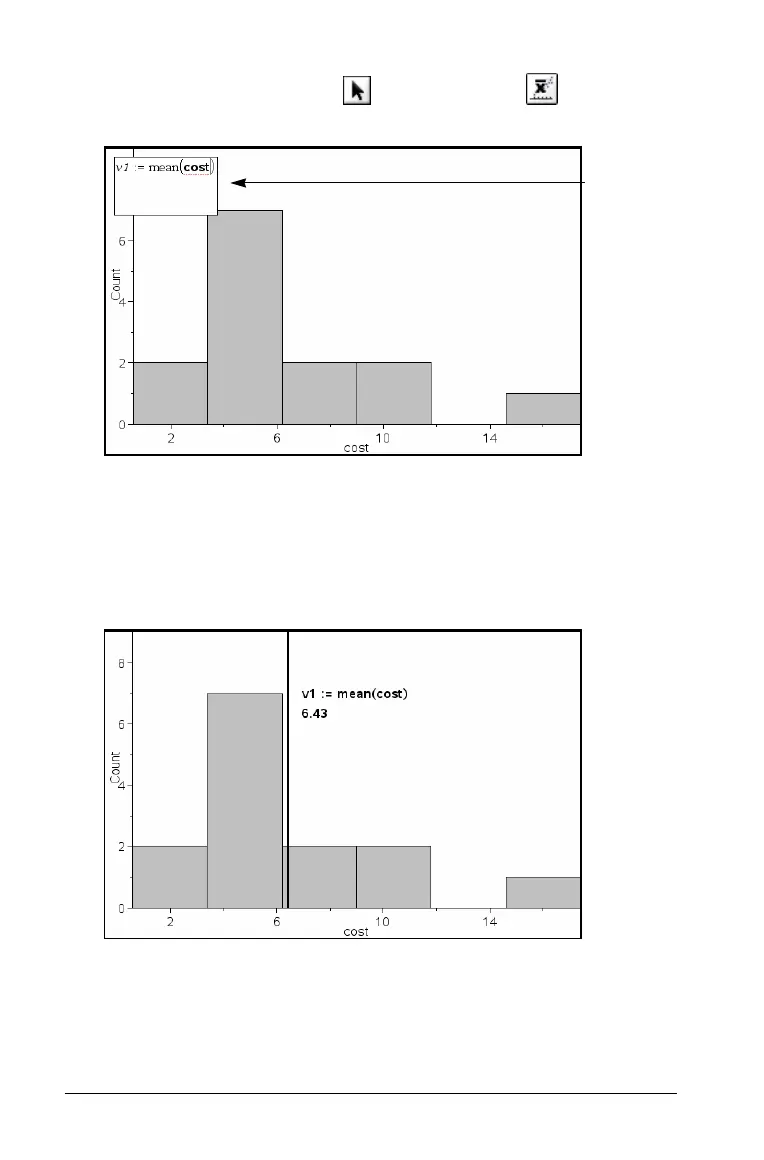
1. From the Actions tool menu , select Plot Value . A data entry
box opens in the work area.
2. Type the value you want to plot, and press Enter.
In this example, the value is v1:= mean(cost).
3. The line is drawn at that value, perpendicular to the axis. Click on the
line to display the value.
Note: The value line cannot be moved in the work area.
Plot value
entry box
Plot value line with value displayed

 Loading...


