296 Using Data & Statistics
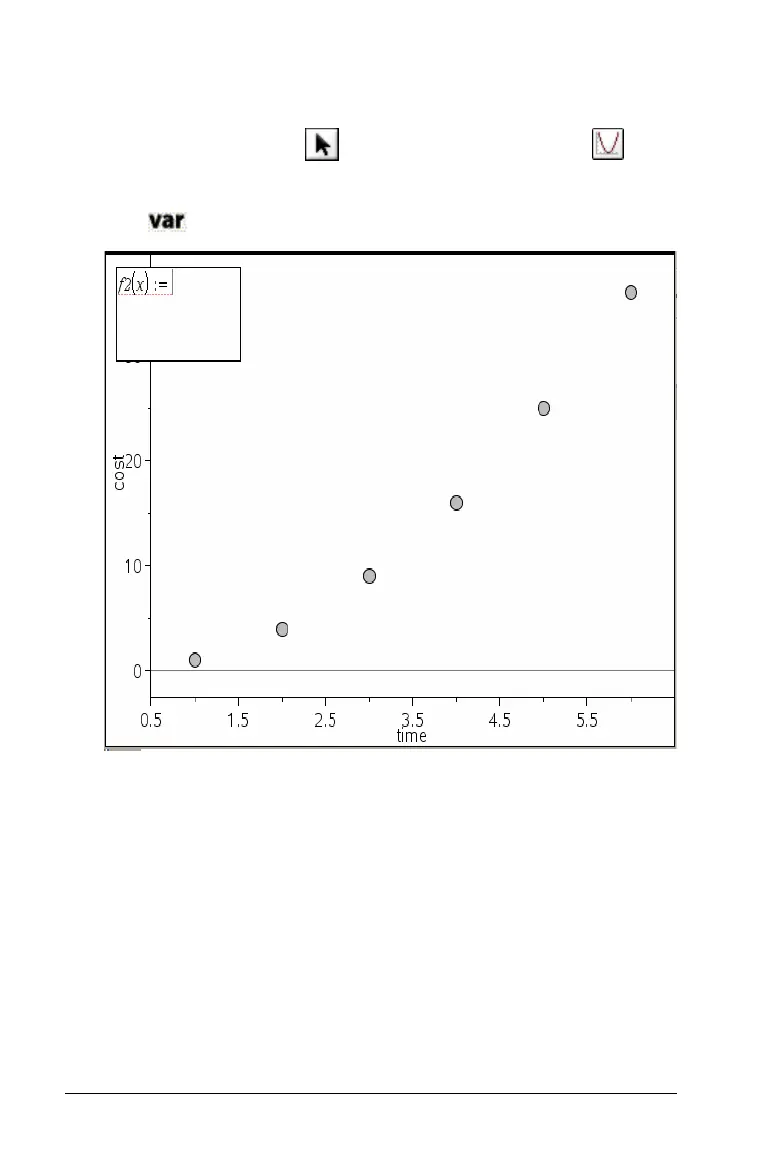
1. Ensure that your work area contains both a horizontal axis and a
vertical axis scale.
2. From the Actions menu , select the Plot Function tool .
A function entry field displays in the work area.
3. Click on the tool bar to open the Variables menu.
A list of variables contained in the problem displays.
4. Click to select the variable containing the function you want to plot.

 Loading...


