5-6 Calibrating the instrument
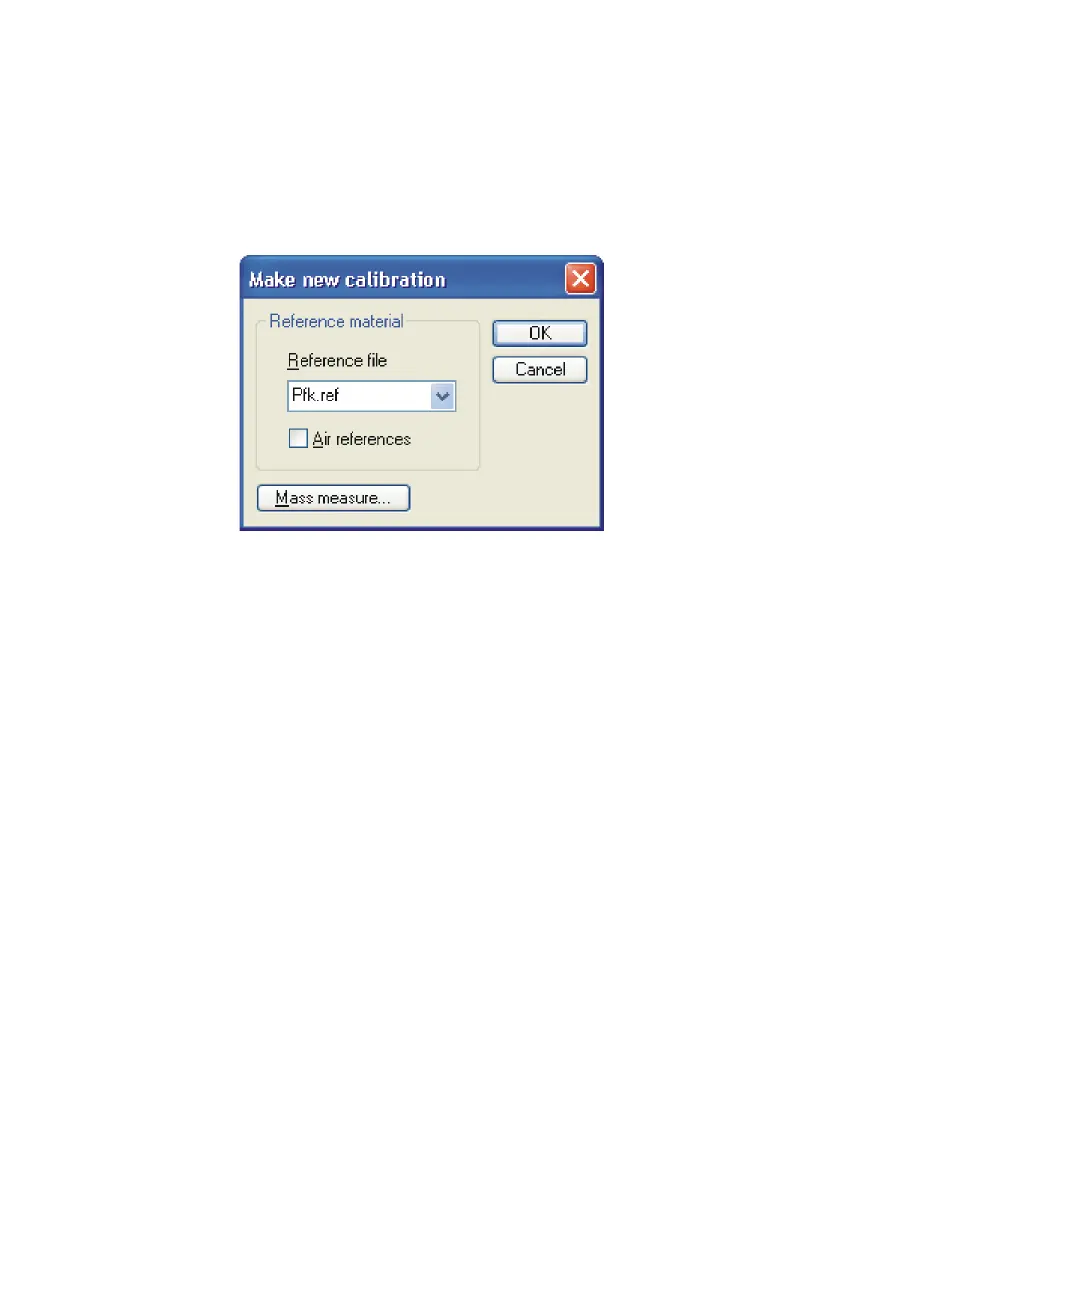
Tip: If the experiment mass range extends below 44 Da and the
reference compound has no masses below this value, you can improve
the calibration by selecting Air references.
Make new calibration dialog box
6. Click OK.
Result: The Calibration report window opens displaying these four
panes:
• Spectrum – Displays the data selected for calibration.
• Reference spectrum – Displays the spectrum of the selected
reference file.
• Mass difference – Plots the mass differences (errors) for the peaks
matched between the spectrum data and the reference spectrum.
• Residuals – Shows the mass difference between the reference
spectrum peaks and the same peaks in the calibrated data.