7. MAINTENANCE
7. Maintenance
One feature of the Nexto Series is the abnormality diagnostic generation, whether they are failures, errors or operation
modes, allowing the operator to identify and solve problems which occurs in the system easily.
The Nexto CPUs permit many ways to visualize the diagnostics generated by the system, which are:
One Touch Diag
Diagnostics via LED
Diagnostics via WEB
Diagnostics via Variables
Diagnostics via Function Blocks
The first one is an innovating feature of Nexto Series, which allows a fast access to the application abnormal conditions.
The second is purely visual, generated through two LEDs placed on the panel (DG and WD) and also through the LEDs placed
in the RJ45 connector (exclusive for Ethernet connection). The next feature is the graphic visualization in a WEB page of the
rack and the respective configured modules, with the individual access allowed of the operation state and the active diagnostics.
The diagnostics are also stored directly in the CPU variables, either direct representation (%Q) or attributed (AT variable), and
can be used by the user application, for instance, being presented in a supervisory system. The last ones present specific
conditions of the system functioning.
These diagnostics function is to point possible system installation or configuration problems, and communication network
problems or deficiency.
7.1. Module Diagnostics
7.1.1. One Touch Diag
The One Touch Diag (OTD), or single touch diagnostics, is an exclusive feature the Nexto Series brings for the pro-
grammable controllers. With this new concept the user can verify the diagnostics of any module connected to the system
straight on the CPU graphic display with a single touch on the module Diagnostic Switch. This is a powerful diagnostic tool
which can be used offline (with no need of supervisory or programming software) making easier to find and solve quickly
possible problems.
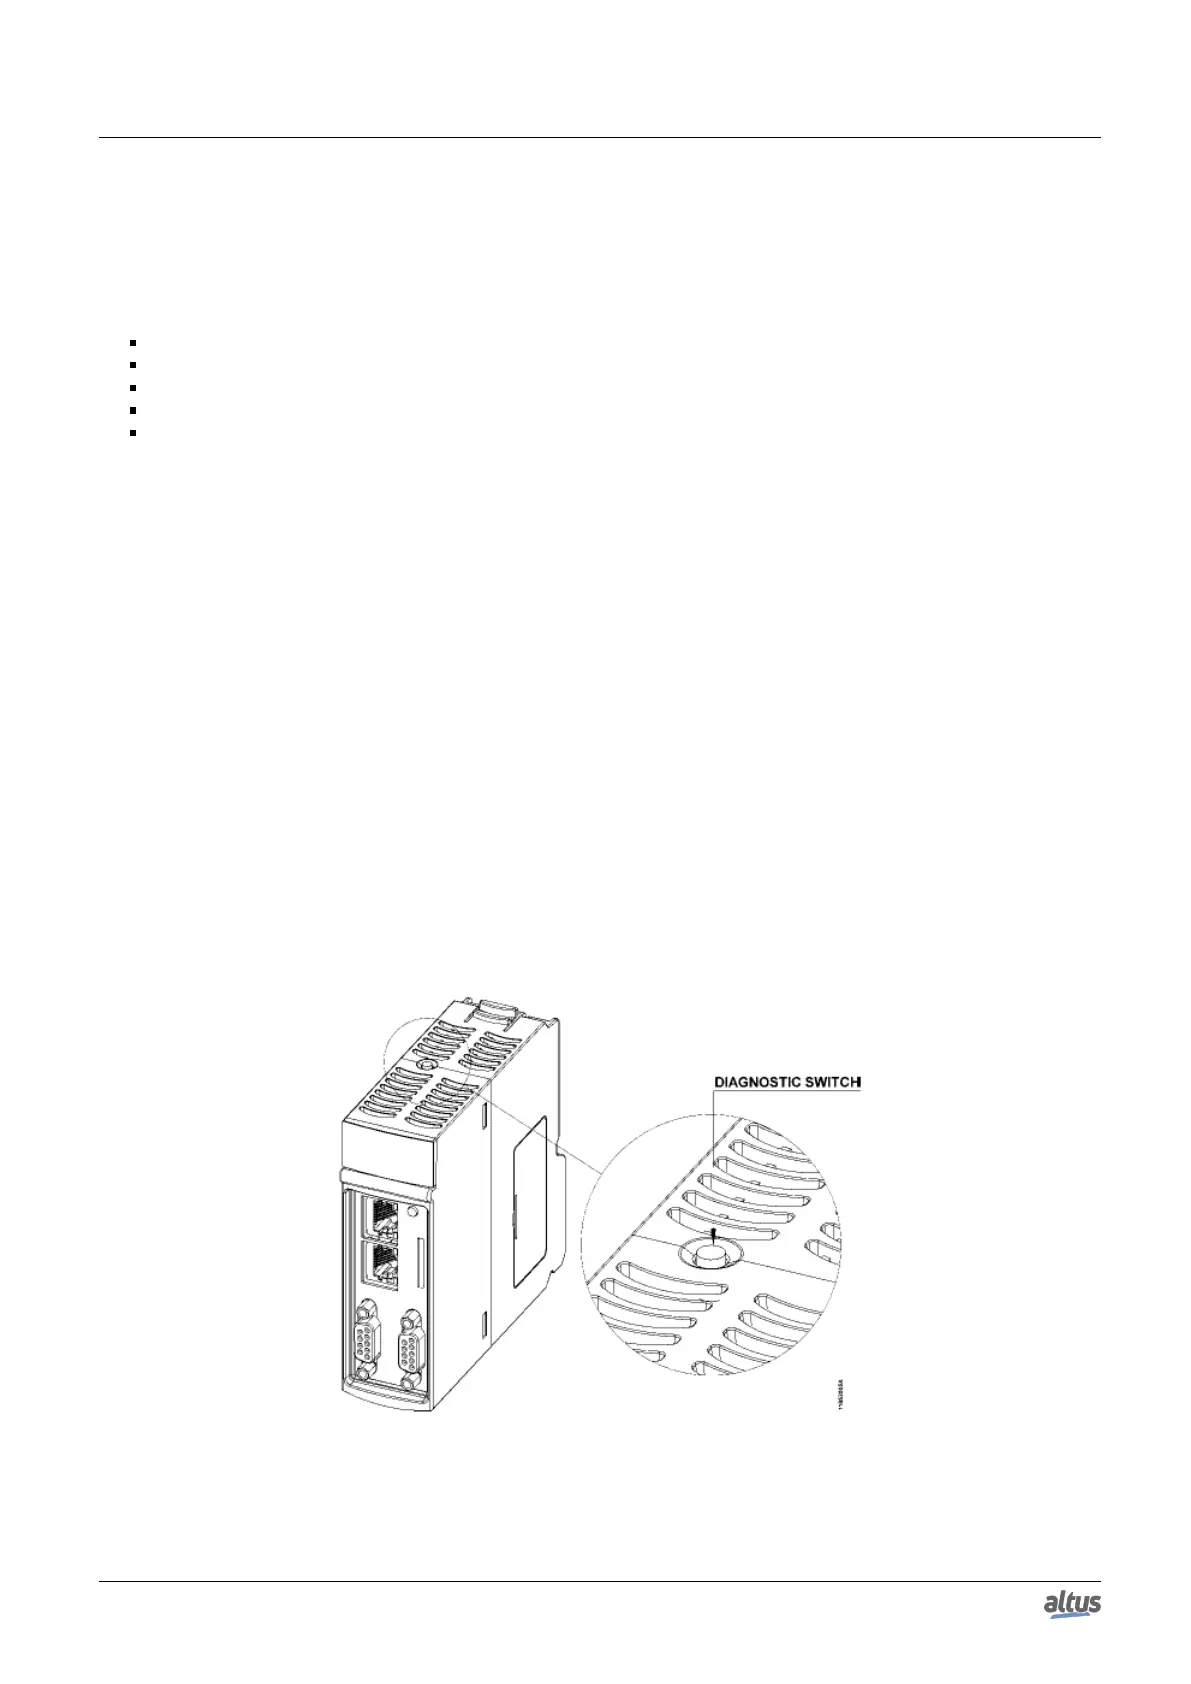
The diagnostics key is placed on the CPU upper part, in an easy access place and, besides giving active diagnostics, allows
the access to the navigation menu, described in the Configuration – CPU’s Informative and Configuration Menu section.
The figure below shows the CPU switch placement:
Figure 189: Diagnostic Switch
With only a short touch, the CPU starts to show the bus diagnostics (when active, otherwise shows the “NO DIAG”
message). Initially, the Tag is visualized (configured in the module properties in the MasterTool IEC XE software, following
351
 Loading...