5.37
Date Code 20130214 Instruction Manual SEL-2414 Transformer Monitor
Metering and Monitoring
Monitoring
Through-Fault Event
Monitor
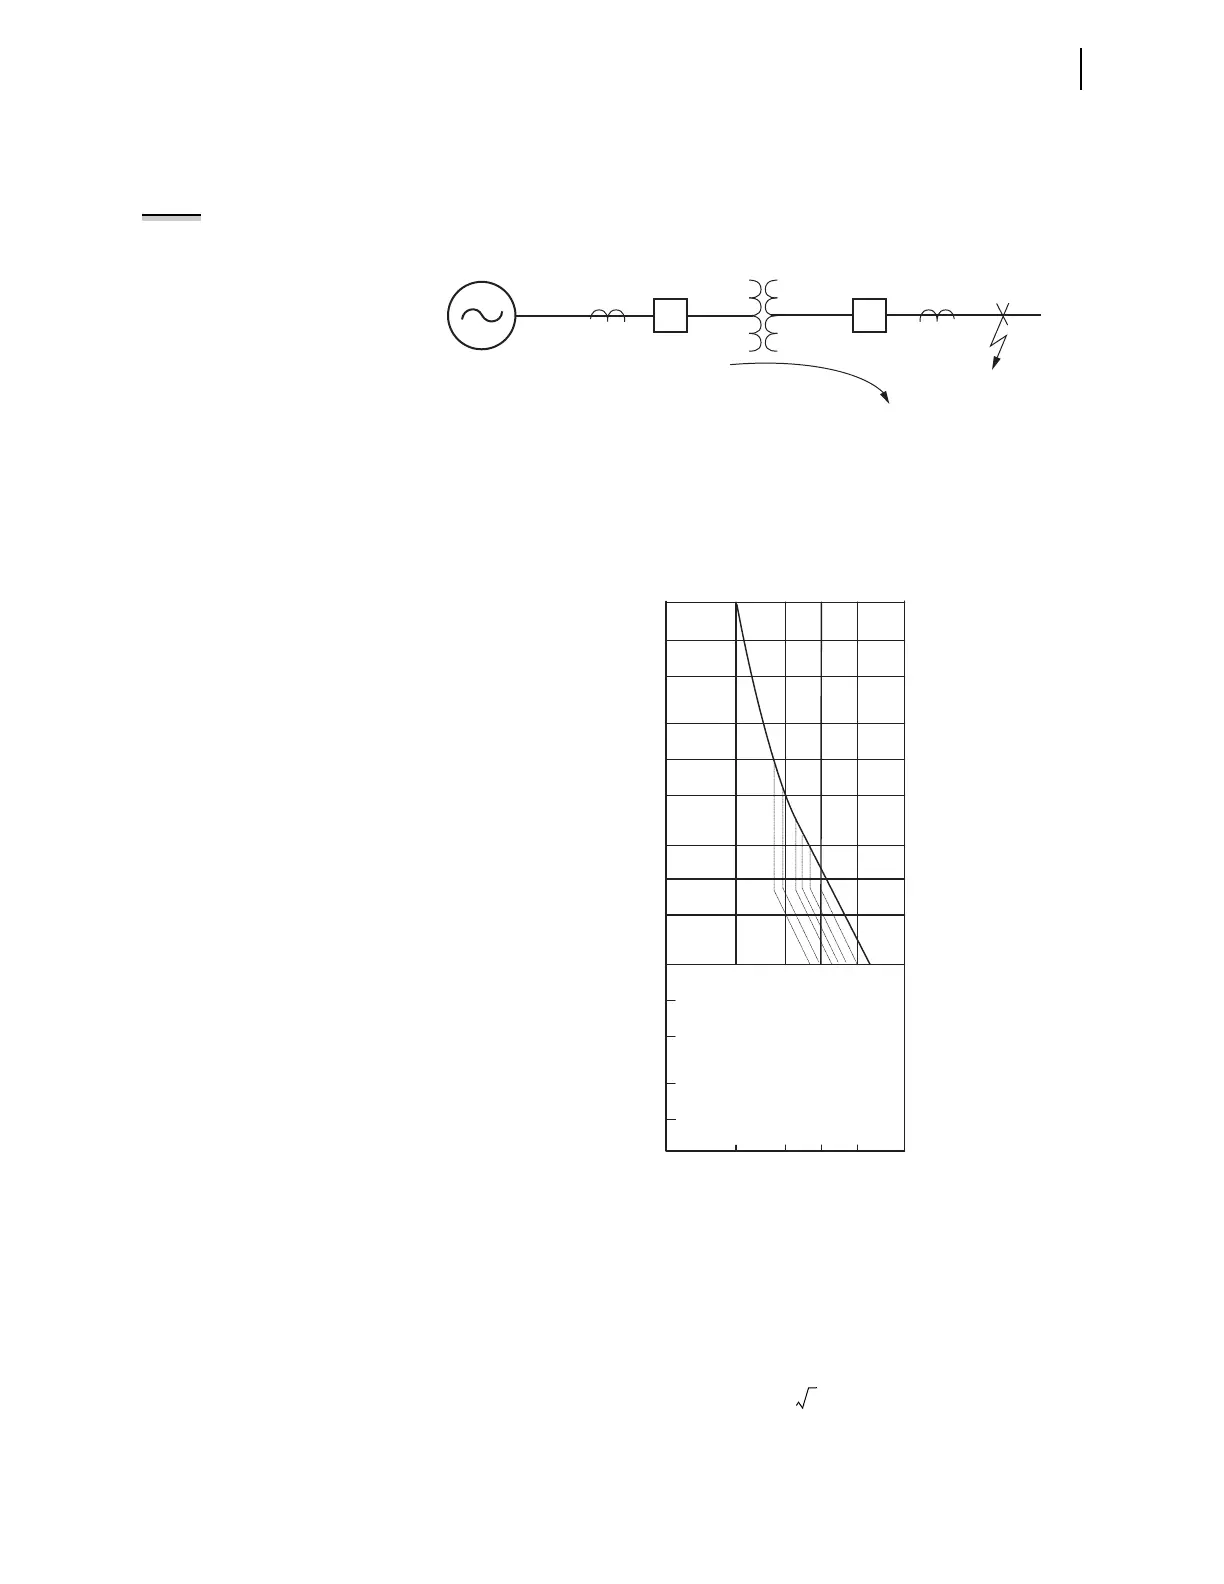
Figure 5.25 shows a fault that occurs outside the area of unit protection of the
transformer. Such through faults can last for several cycles, subjecting the trans-
former windings to mechanical stress and the transformer winding insulation to
thermal stress.
Figure 5.25 Transformer Bank Subjected to Through Fault
Figure 5.26 shows through-fault curves for Category IV transformers as
published in IEEE Standard C57.109-1993. These curves apply to transformers
that are covered by the IEEE standard or, in general, to transformers that were
built beginning in the early 1970s. For transformer built prior to 1970, consult the
manufacturer to obtain the transformer short-circuit withstand capabilities.
Figure 5.26 Category IV Transformers Through-Fault Protection Curves
The curves in Figure 5.26 are a function of the transformer short-circuit
impedance, and is keyed to the maximum I
2
t of the worst-case mechanical duty
(maximum fault current for 2 seconds). Equation 5.22 through Equation 5.24
shows the three equations that the element uses to evaluate the thermal curve
each processing interval. Note that the calculated currents are in primary values.
Equation 5.22
NOTE: Through-fault monitoring
cannot be enabled if ETHERM = W. In
that mode, there is only current
monitoring on one phase of each
winding, so fault currents cannot be
monitored accurately.
Source
HV CT
HV
Breaker
Transformer
LV
Breaker
LV CT
Fault
% Transformer Impedance
Time (seconds)
2000
1000
500
200
100
50
20
10
5
2
1
0.5
0.2
0.1
Times normal base current
21055020
For fault current from 50%
to 100% of maximum: l
2
t=k
where:
l = Symmetrical Fault current
times normal base current
k = constant determined at
maximum l with t = 2 seconds
12 10 8 7 6 5 4
I
MAG_PU
=
I
MAG
3kV
LL
• •
S
------------------------------------------------