Version 7.2 941 Mediant 800B Gateway & E-SBC
User's Manual 59. Viewing Performance Monitoring
Note:
• Forwarded calls are not considered in the calculation for ASR and NER.
• If you don't configure thresholds for a specific metric, the device still provides
current performance monitoring values of the metric, but does not raise any
threshold alarms for it.
• You can configure the device to perform certain actions, for example, reject calls
to the IP Group for a user-defined duration, if a threshold is crossed. For more
information, see 'Configuring Quality of Service Rules' on page 335.
• The section is applicable only to the SBC application.
The following procedure describes how to configure Performance Profile rules through the
Web interface. You can also configure it through ini file (PerformanceProfile) or CLI
(configure system > performance-profile).
To configure a Performance Profile rule:
1. Open the Performance Profile table (Monitor menu > Monitor tab > Performance
Monitoring folder > Performance Profile).
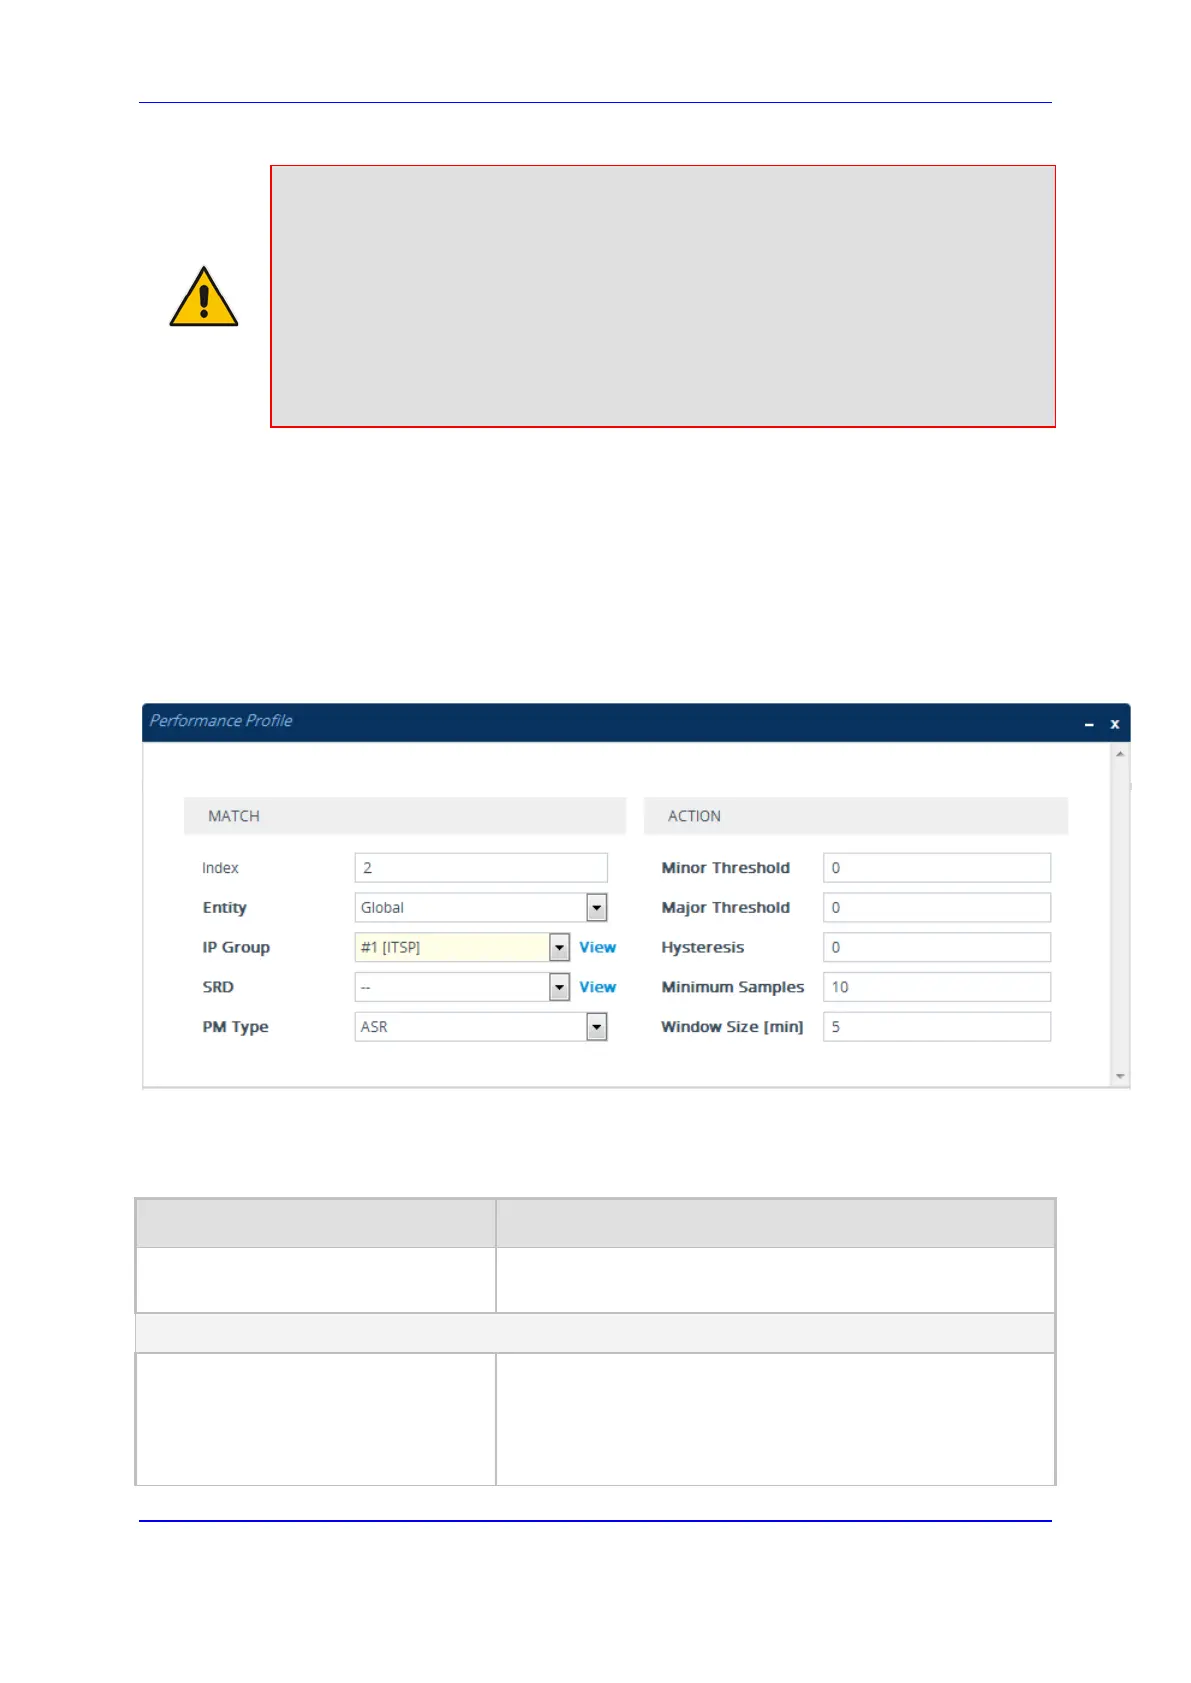
2. Click New; the following dialog box appears:
Figure 59-5: Performance Profile Table - Dialog Box
3. Configure the rule according to the parameters described in the table below.
4. Click Apply.
Table 59-3: Performance Profile Table Parameter Descriptions
Parameter Description
Index
[PerformanceProfile_Index]
Defines an index number for the new table row.
Note: Each row must be configured with a unique index.
Match
Entity
entity
[PerformanceProfile_Entity]
Defines a configuration entity type to which you want to
apply the rule.
[0] Global = (Default) The device calculates call metrics
for all calls.
[1] SRD = Assigns an SRD. To specify the SRD, use the
 Loading...