85
Power consumption
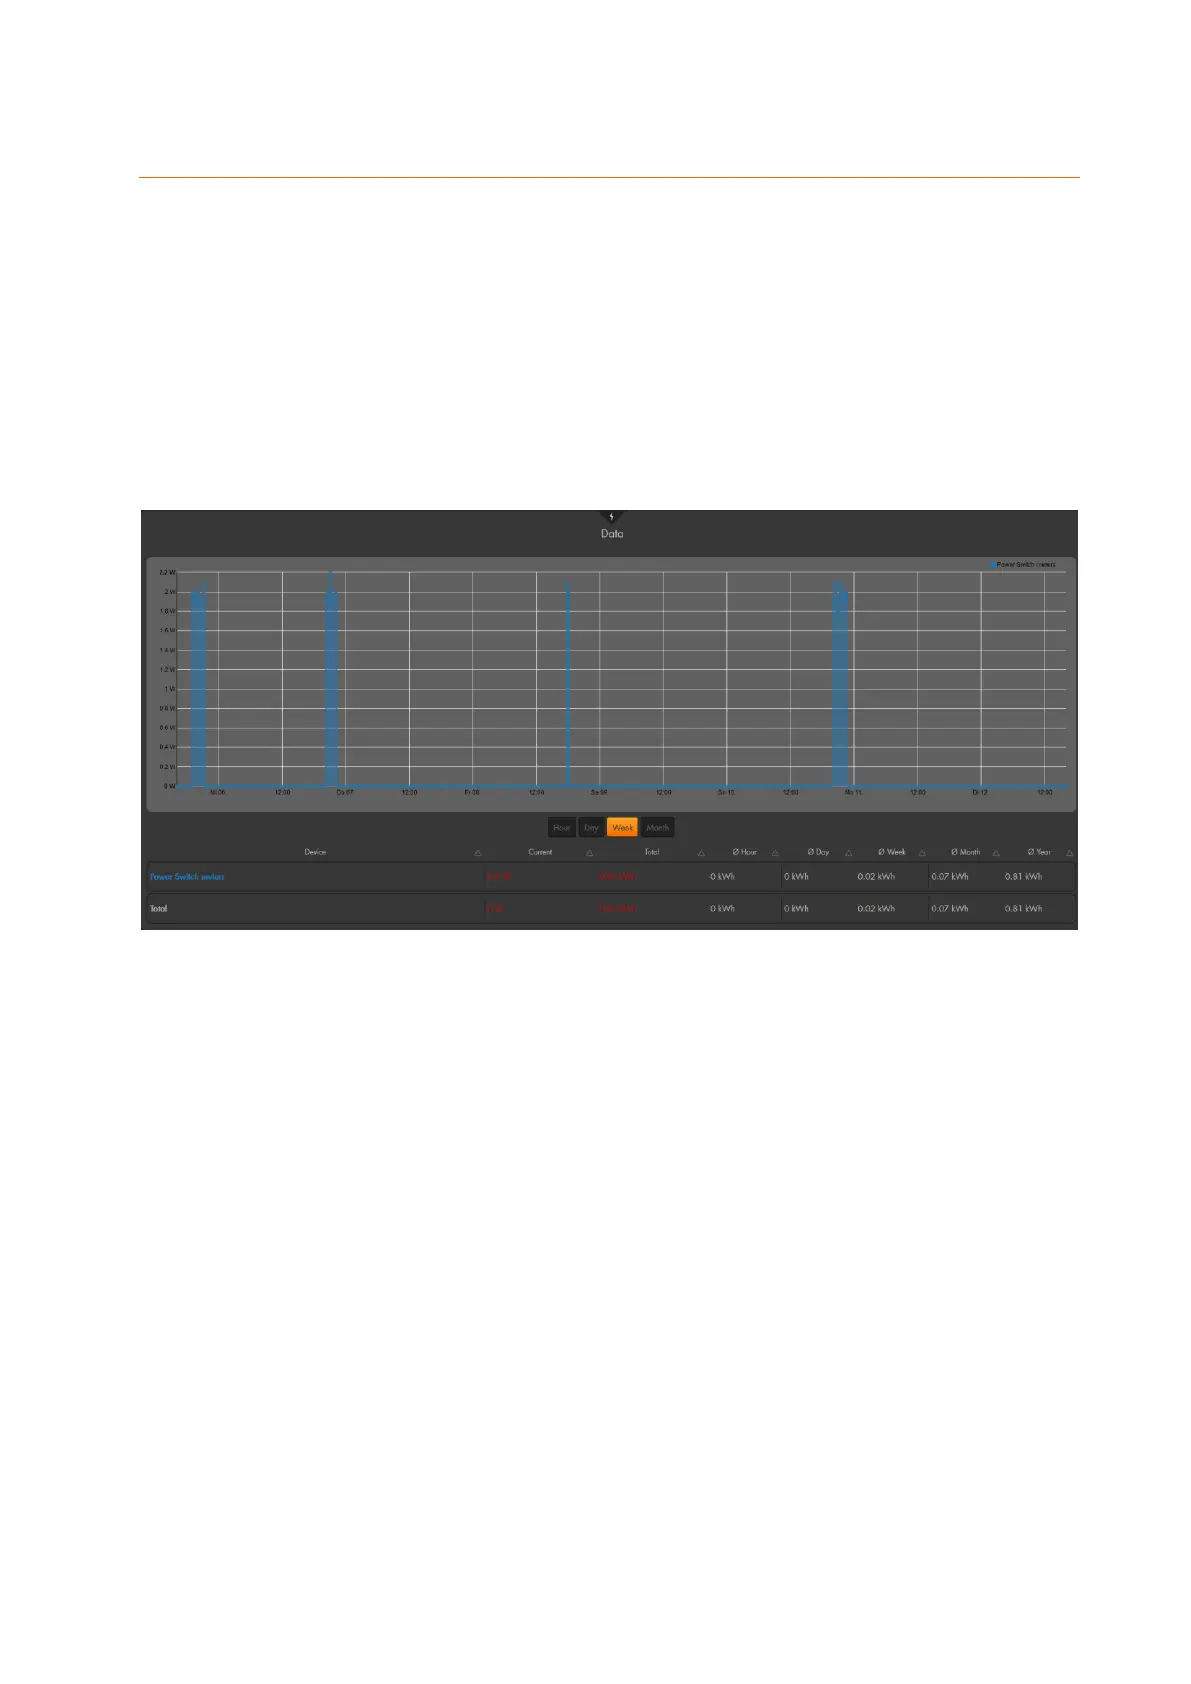
The table on the bottom of the screen shows the current, the average, and the
extrapolated power consumption of the added devices with electric meter (e.g. remote
controlled mains socket or in-wall relay # 12051).
You can select if you want to display the power consumption of the last hour, day, week,
or month. Depending on your selection, the graph is adjusted.
Each device with power meter is displayed in a different colour, which superimpose each
other in the graph. If you want to hide the graph of a device, click on the name above the
graph. Click again to display the graph of the device again.
The power consumption of the PSS devices is saved at intervals of ten minutes or, if the
consumption deviates within this interval by 2 watt and 5%. Additionally, you can view the
consumption values via the menu “System” “Logs” “Sensor messages”
Please note:
Depending on the amount of integrated PSS devices and the amount of saved
data, it may take a few minutes until the graph is compiled and the page is shown!
In order to reset the values in this menu, you need to delete the PSS device and
add it again to the alarm panel.