CMU Measurement Control
1100.4903.12 3.17 E-9
Configuration
of measurements
A Configuration popup menu offering specific settings is assigned to most
measurement groups (see e.g. the Power and Spectrum measurements in the
RF function group and the Multitone measurement in the Audio function group).
The Configuration menu also provides general parameters that can be defined
independently in many measurement groups:
• The repetition mode, the stop condition, the statistic count and the display
mode for the measurement (Control)
• Tolerances for the measured quantities (Limits, Limit Lines)
These settings are explained in more detail below (see section General Settings
on page 3.18 ff.). For a detailed explanation refer to the manuals for network
tests listed before tabbed divider no. 1.
Measurement Groups
Measurement results are indicated in two different ways:
• Discrete values and parameters are displayed in output fields, lists and tables. In remote control,
these results are referred to as scalars.
• Measurement curves (traces) are displayed in a Cartesian coordinate system, the time, frequency
or another continuous parameter forming the x-axis scale. Power results are usually plotted in
semi-logarithmic diagrams. Relatively small sets of test points are generally viewed in a bar graph.
In remote control, results of this type are referred to as arrays.
While the measurement is running in repetition mode continuous (see page 3.18), the indicated results
are constantly updated. Each function group and measurement mode comprises a particular selection
of measurement groups. The measurement groups belonging to function group RF (Non Signalling)
and Audio (with option CMU-B41) are shown in the following tables.
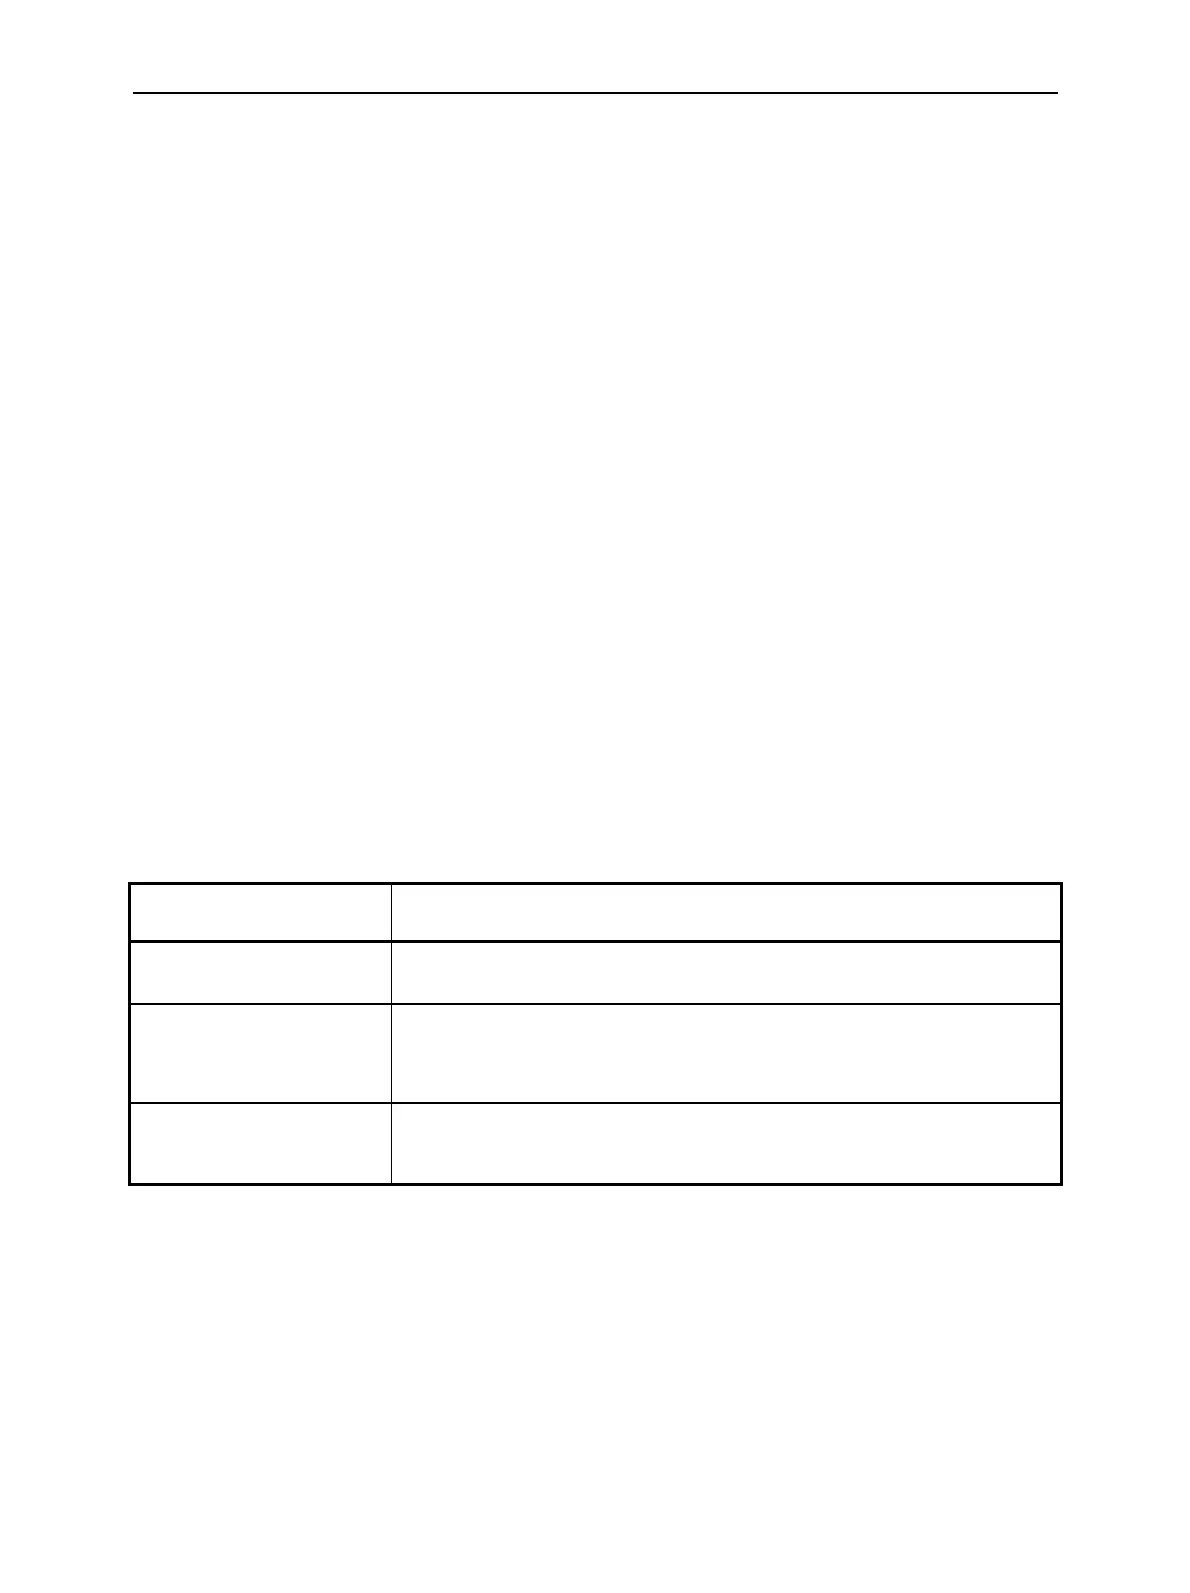
Table 3-4 Measurements in function group RF (Non Signalling)
Menu Function
Analyzer/Generator
Shows the settings for the signals generated and analyzed by the instrument, the generator
status, and the state of the RF analysis. Moreover the current analyzer power is indicated.
Power
Shows the trace of the measured RF power in oscillographic representation, i.e. as a
function of time. The maximum level and frequency of the input signal is indicated in
addition. Single points of the trace may be evaluated using graphical tools (markers, D-
Line).
Spectrum
Shows the trace of the measured RF power in spectral representation, i.e. as a function of
the frequency. Parameters of the measurement are indicated in addition. Single points of
the trace may be evaluated using graphical tools (markers, D-Line).

 Loading...