CMU RF: Power vs. Time Measurement
1100.4903.12 4.45 E-10
Measurement
curves
(arrays)
The measurement curve is displayed as a continuous trace in the test diagram
together with the limit lines, markers and the D-line, if defined.
The measurement curve in the Power measurement menu shows the measured
power of the received RF signal (in dBm) as a function of time (in µs). The diagram
scale, which is equal to the measurement range, and the displayed result depend
on the test settings. The display mode for the measurement curve (Minimum,
Maximum, Average, Current) is indicated in the upper right corner of the diagram.
Remote control
READ:ARRay:POWer[:RESult]...?
FETCh:ARRay:POWer[:RESult]...?
SAMPle:ARRay:POWer[:RESult]...?
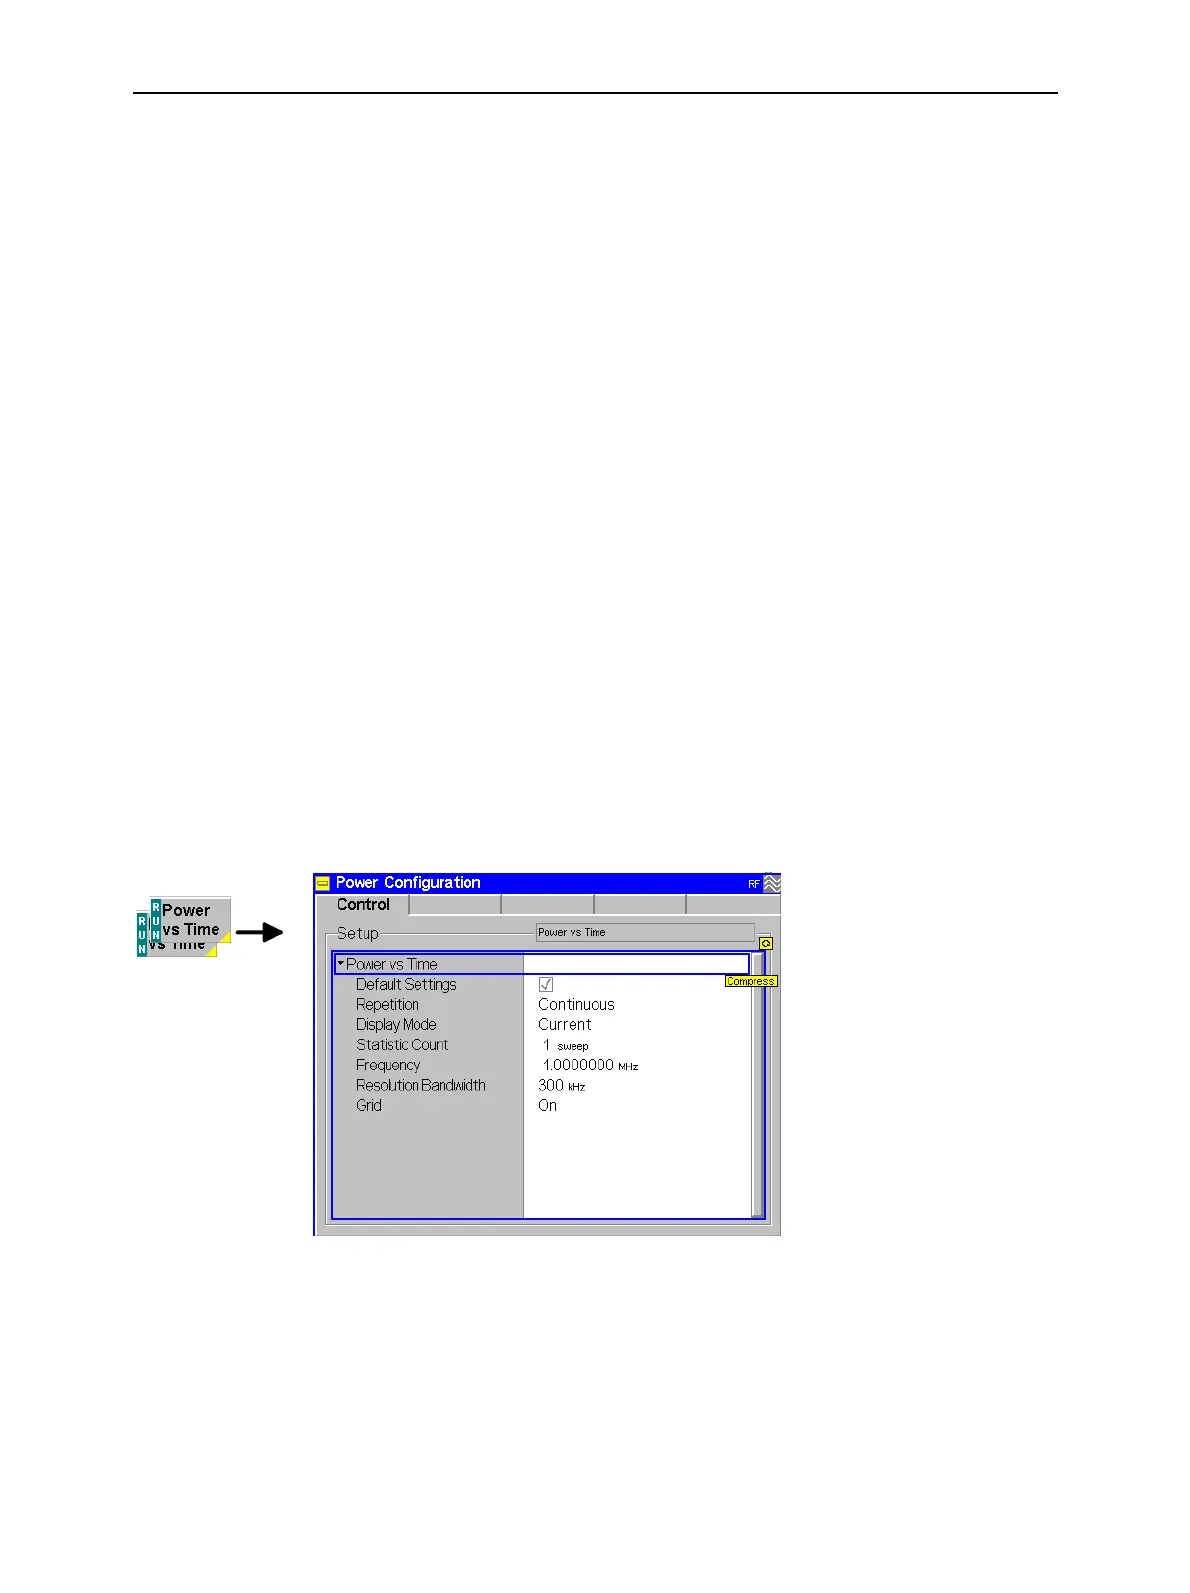
Measurement Configurations (Power Configuration)
The popup menu Power Configuration determines the parameters of the power measurement. It is acti-
vated by pressing the softkey Power in the graphical measurement menu Power twice.
The Power Configuration menu controls the power measurement. It defines:
The Repetition mode
The type of measurement curve to be displayed (Display Mode)
The Statistic Count for the measurement
The center Frequency of the RF analyzer
The Resolution Bandwidth of the measurement filter
Besides, it influences the power display by adding or removing the Grid.
Fig. 4-23 Power Configuration – Control
Default Settings
The Default Settings switch assigns default values to all settings in the Control tab
(the default values are quoted in the command description in chapter 6 of this man-
ual).
Remote Control
–

 Loading...