Measuring EI sensitivity from the solids probe 7-87
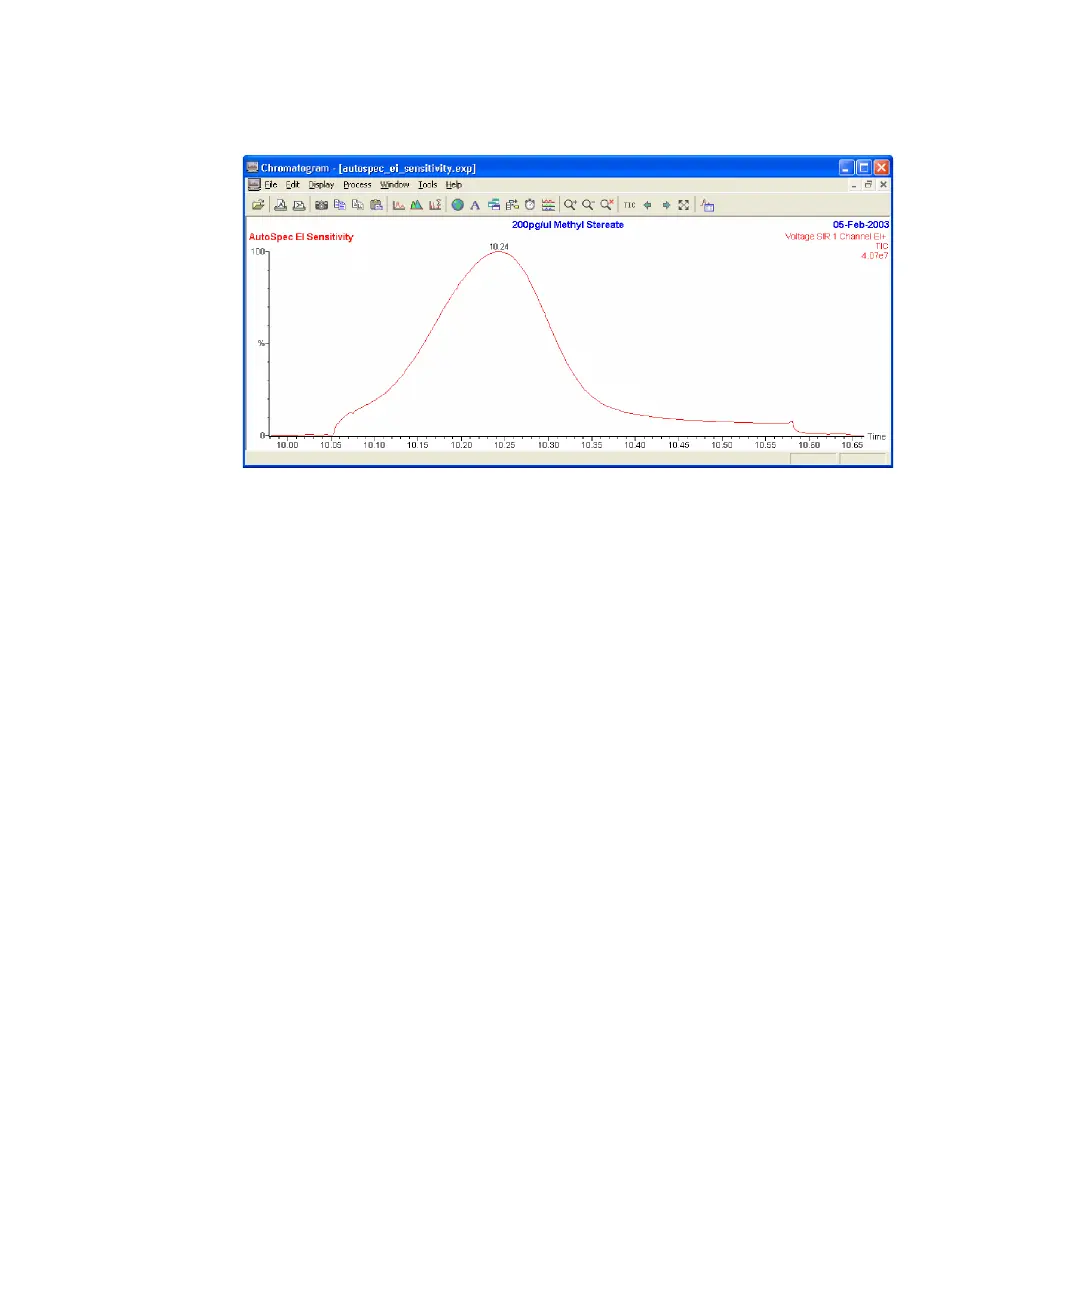
EI sensitivity chromatogram
14. Repeat steps 7 and 10 twice, using a new sample cup each time.
To process the data
1. In the chromatogram window, click Edit > Integrated Peaks.
2. Zoom in on the first desorption curve.
3. Right-click and drag along the horizontal axis to define the area of the
curve over which to integrate.
4. In the Edit Integrated Peaks dialog box, click Add.
5. Record this value of the area (A1).
6. Repeat steps 2 to 4 for the remaining two desorption curves (Areas A2
and A3).
7. Calculate the average area of the peaks, using the values in the
following figure as an example:
Where A is the average area of the peaks in bit-minutes.
A
A1 A2 A3++
3
-----------------------------------
7232969 7400556 7963153++
3
---------------------------------------------------------------------------==