Chapter 15 9100 Data Exchange Software
Saving, loading and printing results on the PC
234 9102 Handheld Spectrum Analyzer Software version 5.31
4 Move the cursor to the position where to insert the graph.
5 Press Ctrl+V or select
Edit > Paste to insert the graph.
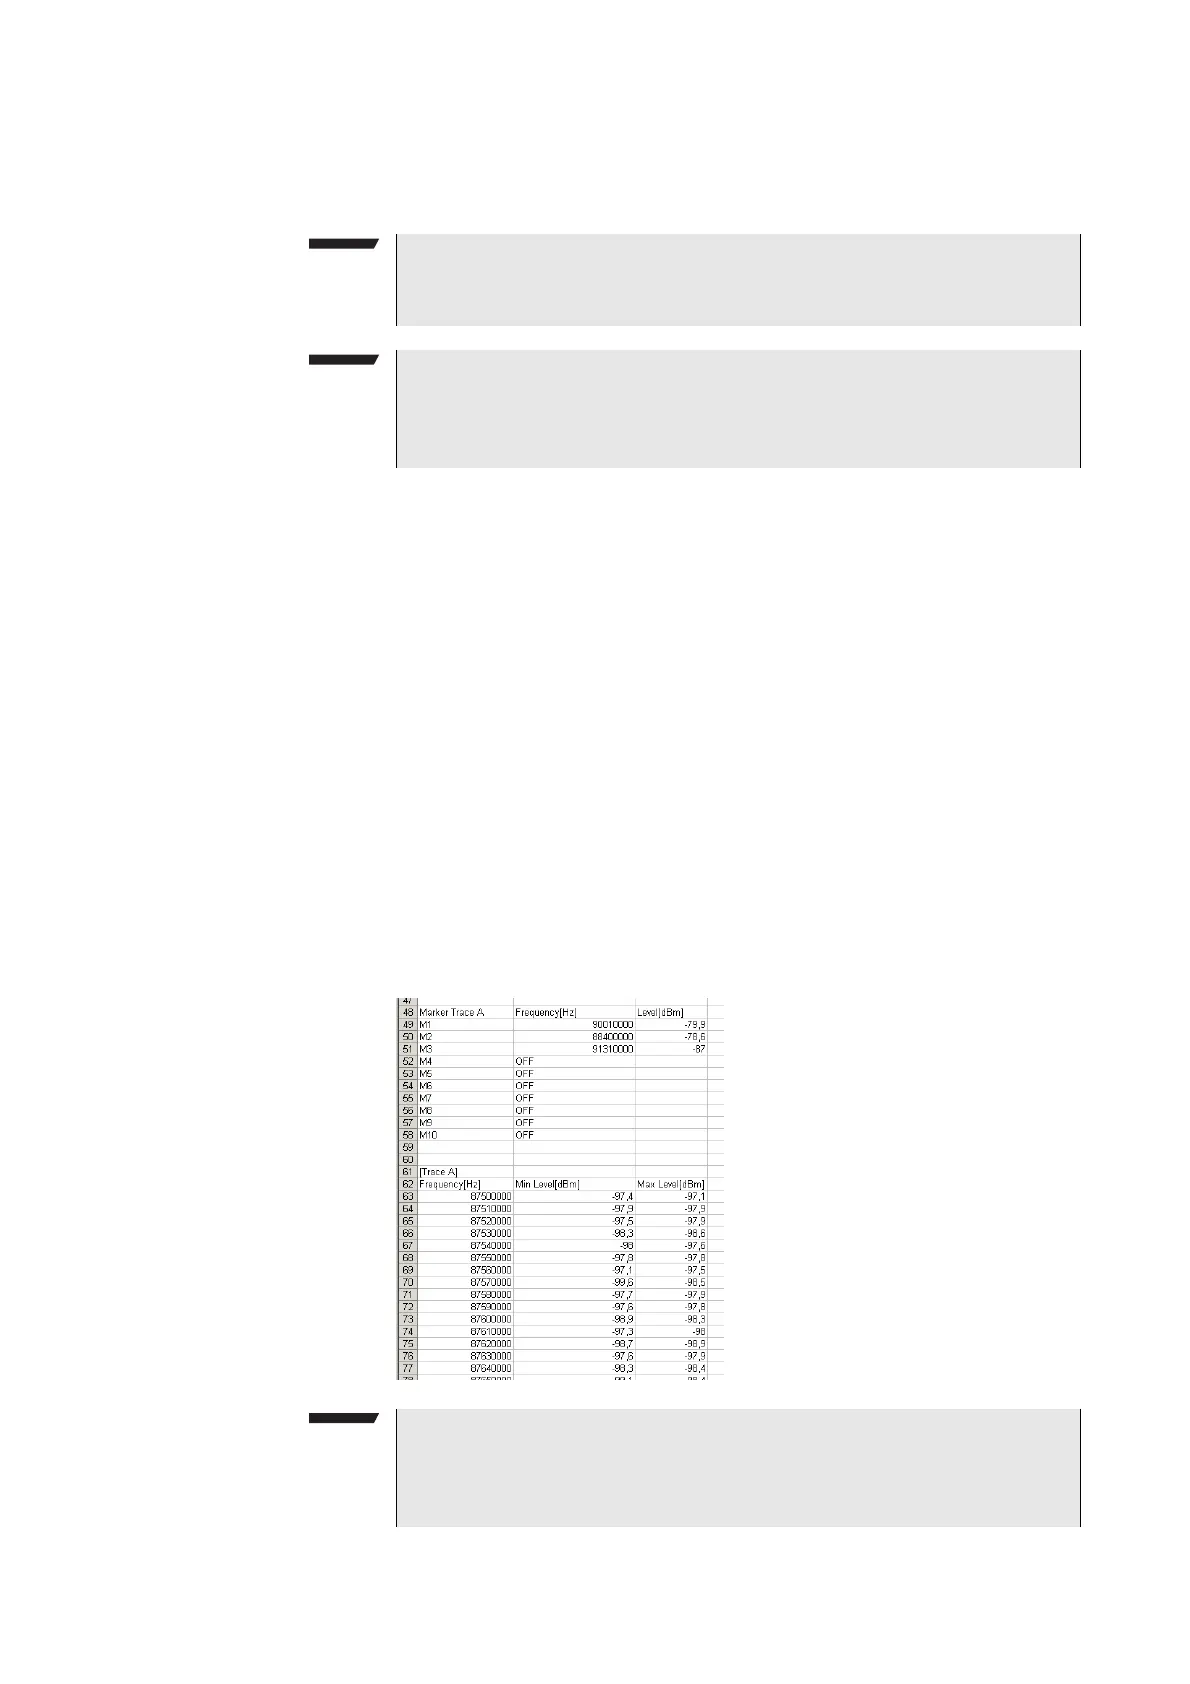
Data copy and paste You will want to copy the data rather than the graphics if you want to
post-process the data, e.g. in a spreadsheet.
1 Select the trace you want to copy by selecting the apppopriate
number in the Window menu.
2 Select
Edit > Copy Data.
All the relevant measurement data and instrument settings are
copied as text into the Windows clipboard.
3 Press Alt+Tab or the mouse to change to the application where you
want to insert the data (e.g. Microsoft Excel).
4 Move the cursor to the position where to insert the data.
5 Press Ctrl+V or select
Edit > Paste to insert the data.
The data is copied into the document. Measurement data and
instrument settings are separated by a comma, so most spread-
sheet programs will nicely place the data in individual columns.
Note
If you want to resize the graph in Microsoft Word, select Format >
Picture and change to the Size tab to resize it.
Note
The 9100 Data Exchange Software copies the window in the size it
currently has on the screen. You can resize the window to copy the
graph in a different size or aspect ratio.
Note
You can even have Microsoft Excel (or another spreadsheet pro-
gram) draw the trace: Mark the table containing the measurement
data (e.g. frequency and level points) and call up the Chart Wizard.
 Loading...