Chapter 15 9100 Data Exchange Software
Defining and loading limit templates
9102 Handheld Spectrum Analyzer Software version 5.31
239
Using a grid
The grid of vertical and horizontal lines can be switched on and off with
View > Grid. You can also right-click on the screen to open a right-click
menu and select
Grid. The grid is the same as on the 9102, i.e. it
consists of eight horizontal and ten vertical rows.
Entering text You can add text to the trace and store it with the measurement. This
way, you can add valuable information about the conditions of the
measurement. The comment text will be printed and saved with the
graph but not exported to a graphics or text file.
1 Select
View > Comment.
A “Comment” window opens, allowing you to enter text.
2 Enter your text (three lines maximum), then click on
Save to have
the 9100 Data Exchange Software store the text along with the
measurements.
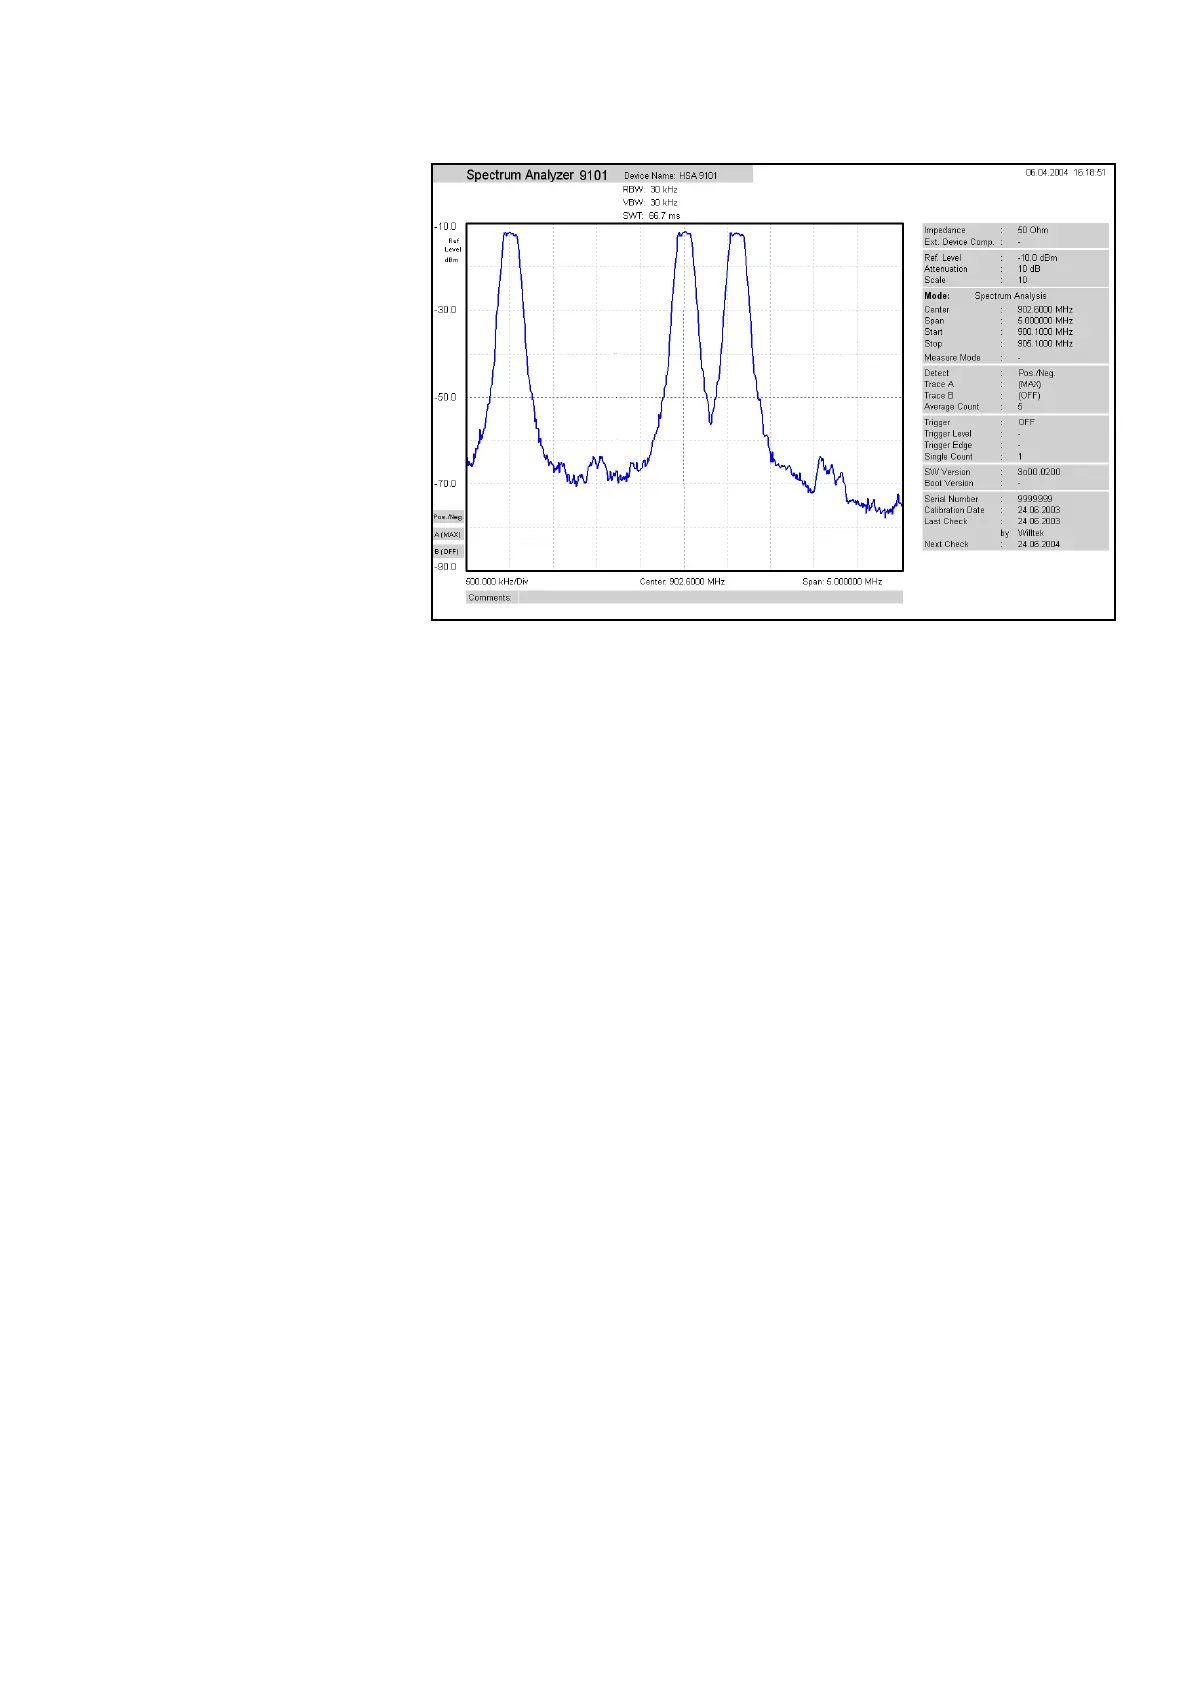
Defining and loading limit templates
One of the powerful features of the 9102 is its capability to compare
the measurements with predefined limits. The limits are set in the form
of a template that the actual measurement passes or fails. The template
can be defined on the PC using the 9100 Data Exchange Software and
then loaded to the 9102; the 9102 can hold up to 99 templates.
Editing a template may be easier when an example of a typical result
trace is available. The Limits Editing menu of the 9100 Data Exchange
Software cannot only show the actual limit curve (template) but also an
example trace that is stored on the PC.
Templates can be applied to measurements in both the spectrum and
the time domain. An example of a limit template in the time domain is
the power/time template for GSM phones.