Drive Tuning D2 Series Servo Drive User Manual
6-18 HIWIN MIKROSYSTEM CORP.
6.5.3 Mathematical operation
“Plot view” also provides some math formulas for the operation of physical quantities, such as the
integration, differentiation, addition, multiplication,…, etc. This allows users to calculate and observe the
calculated result directly in “Plot view”. In addition, it also provides the maximum, minimum, ripple
calculation, and spectrum analysis of each physical quantity.
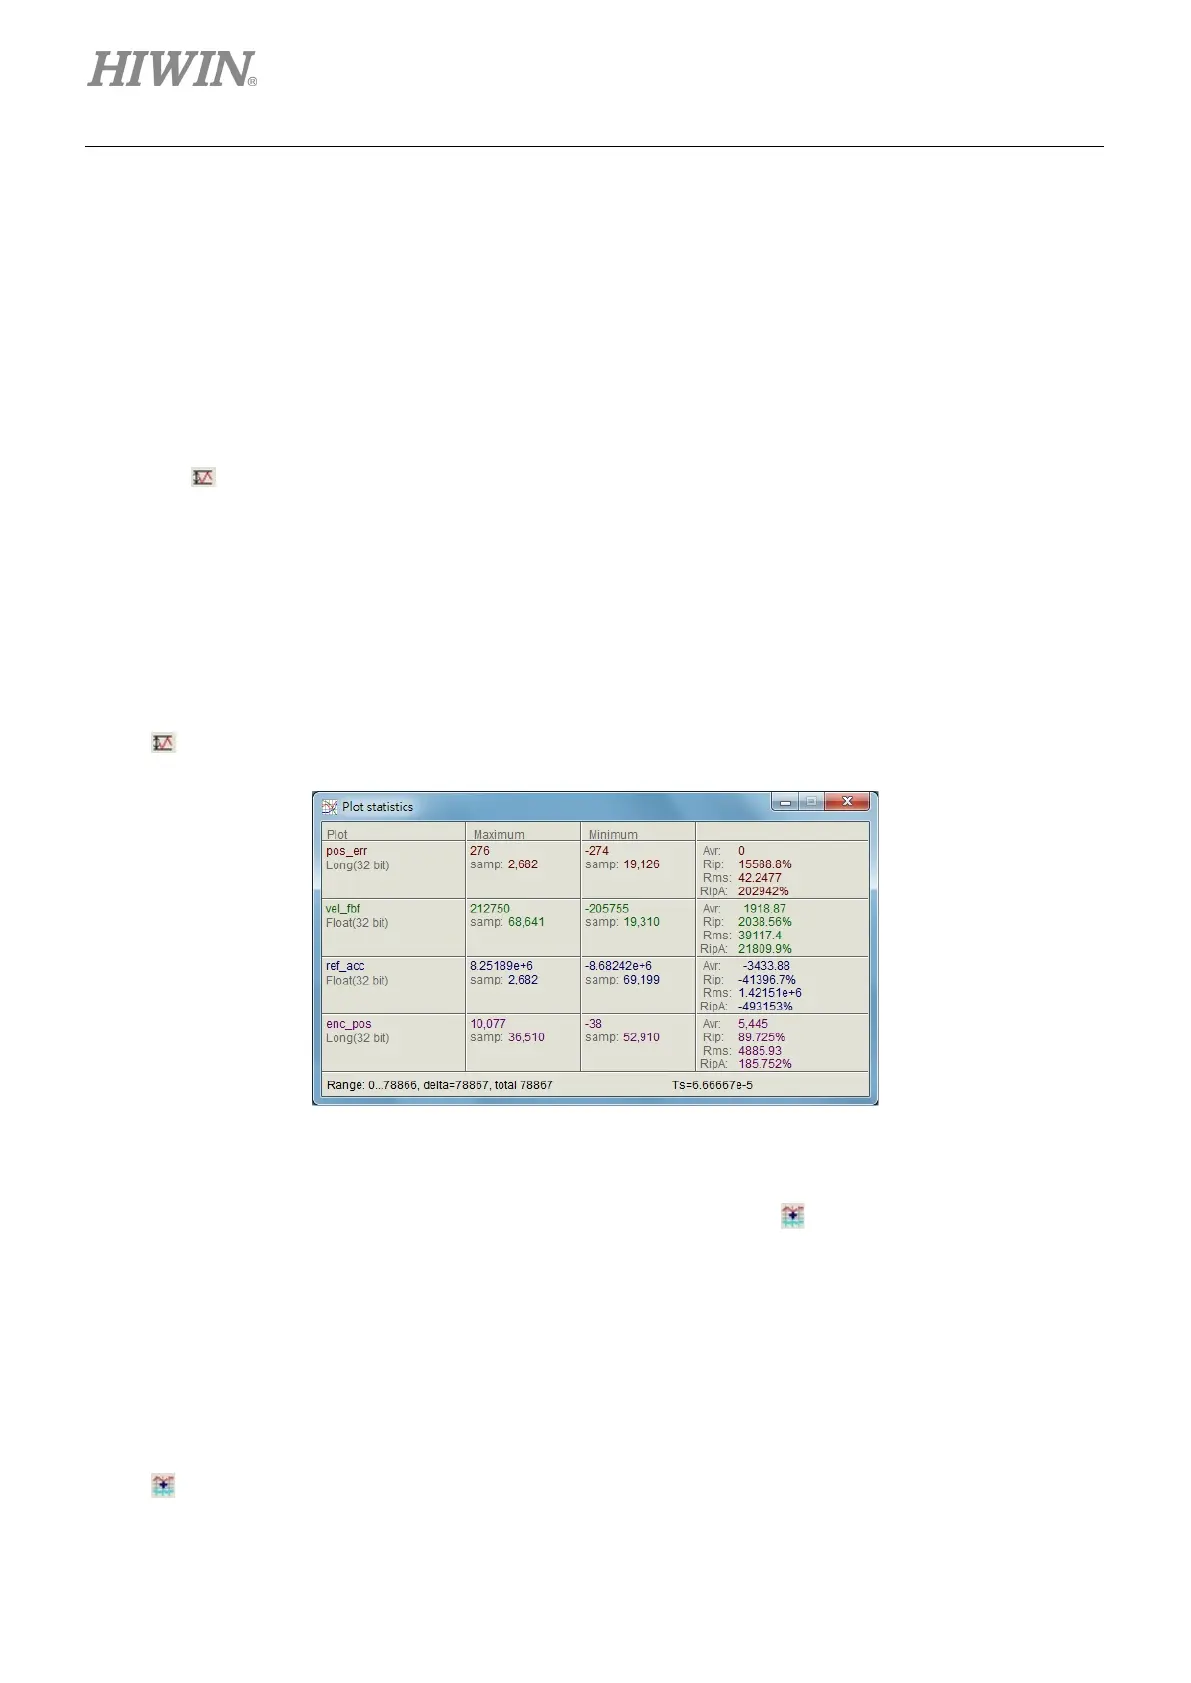
(1) Statistics table
Click
to display the table as shown in figure 6.5.3.1. It shows the maximum, minimum, average,
root mean square (rms), Rip, and RipA of each physical quantity within the interval selected by
cursors, as shown in figure 6.5.3.1. Here,
Rip = standard deviation/average,
RipA = (maximum - minimum) /average.
The related icon on the main toolbar area is described as follows.
-
: The maximum, minimum, root mean square (rms), and ripple calculation of physical quantity.
Figure6.5.3.1 Statistics table
(2) Mathematical operation method
Select “Math operation” of “Tools” in the function menu or click
to open the window of figure
6.5.3.2 to do a proper mathematical operation. Here, take the addition as an operation example.
After clicking the option of “Linear”, choose “pos_err” and “vel_fbf” via the drop-down menu. Then,
name the new physical quantity in the “New plot name” field and set its color. Finally, click the
“Create” button to generate the physical quantity (“lin_1”) of “pos_err” plus “vel_fbf”, as shown in
figure 6.5.3.3. Other mathematical operations are the same as that for addition. Not repeat them
here. The related icon on the main toolbar area is described as follows.
-
: Mathematical operation.
 Loading...