Drive Tuning D2 Series Servo Drive User Manual
6-12 HIWIN MIKROSYSTEM CORP.
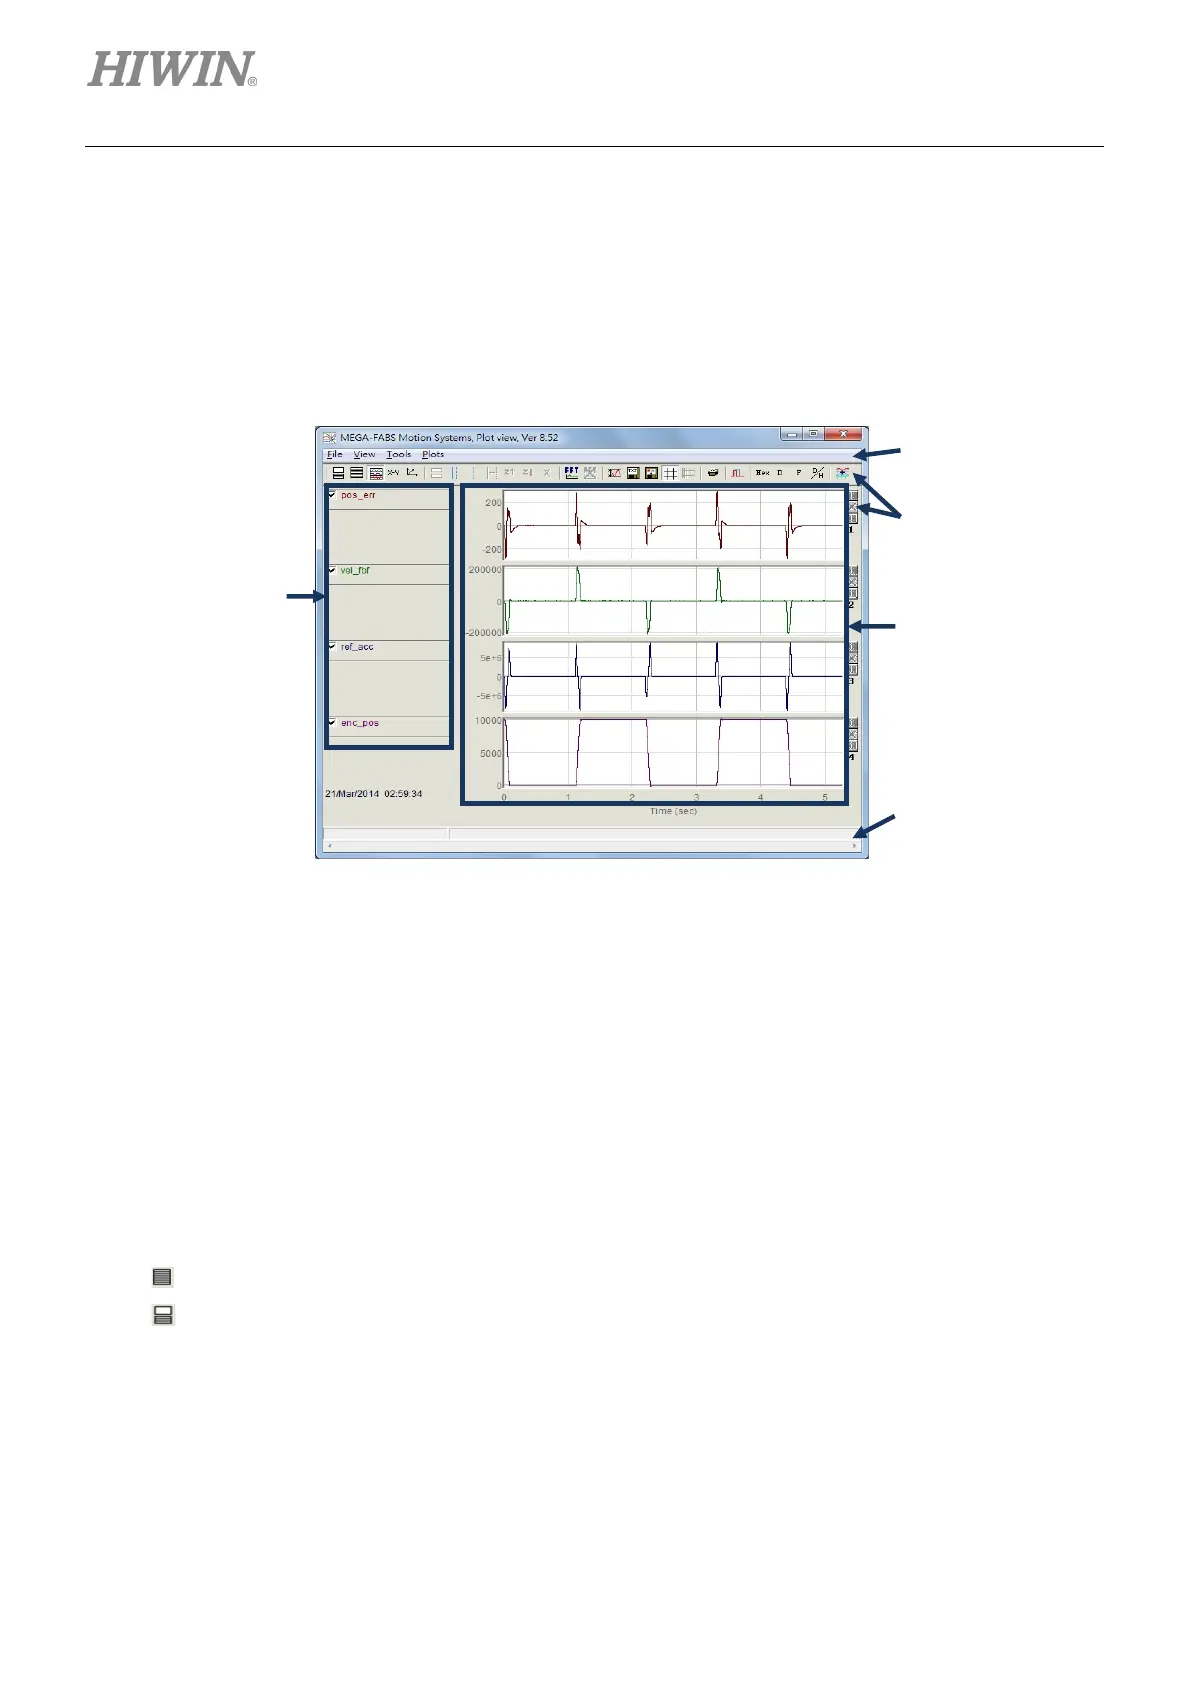
6.5 Plot view
The “Plot view” function is built on the “Data collection” function. It draws the data collected by “Data
collection” into graphics. “Plot view” has a powerful analysis function to provide the measurement and
calculation. It is divided into five areas: function menu area, main toolbar area, physical quantity display
area, graphic display area, and timeline scroll bar area, as shown in figure 6.5.1.
Figure6.5.1 Plot view
6.5.1 Graphic display mode
(1) Number of display channels
The graphic display area is mainly used to display the graph of physical quantity. When the graph of
physical quantity is captured from “Scope” or “Data collection”, “Plot view” will display all physical
quantities selected by “Scope”. “Plot view” can change the number of channels shown in the graphic
display area. However, the maximum limit is not more than eight. The related icon on the main
toolbar area is described as follows.
-
: Set the maximum number of display channels.
-
: Display a single channel.
quantity
display
toolbar area
menu area
display
area
scroll bar
area
 Loading...