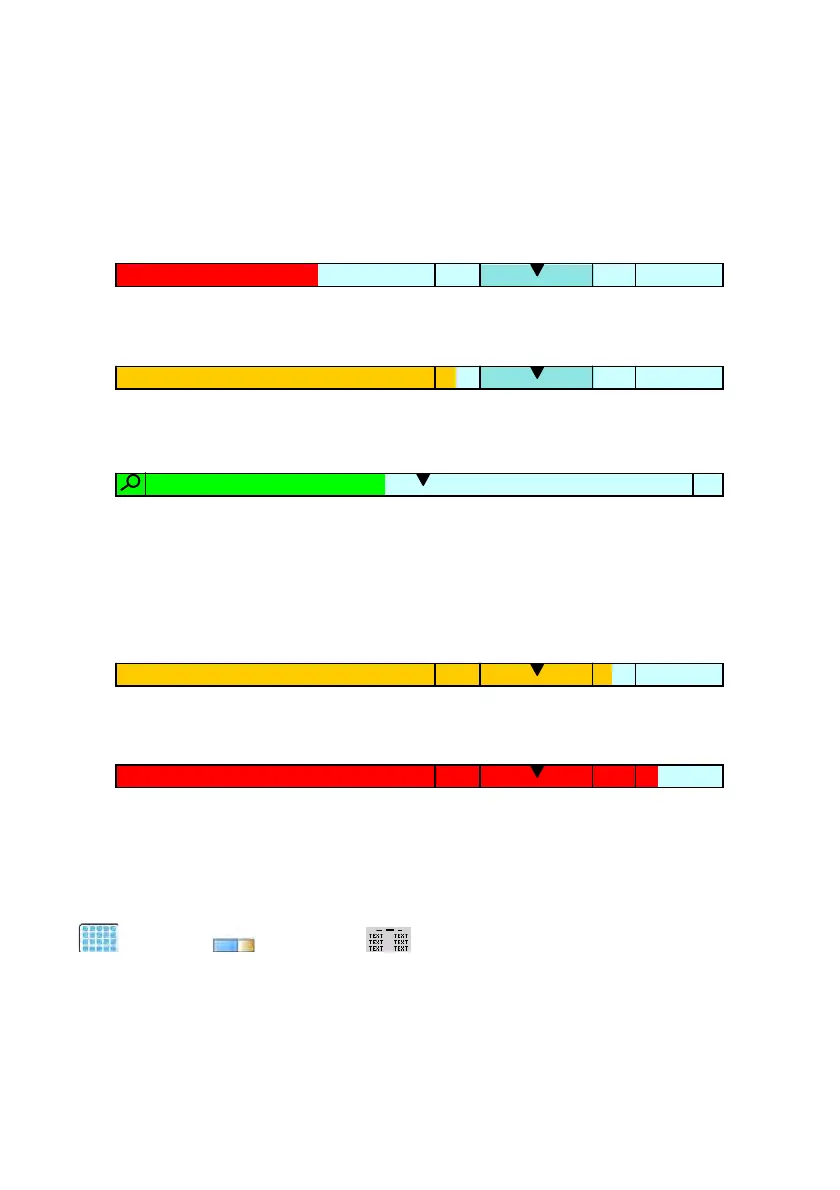
60
Where:
Qn – nominal mass
T – T error
T2 – T2 error
• Signalling mass below set value of Qn-T2:
• Signalling mass between the values of Qn-T2 and Qn-T:
• Signalling mass between the value of Qn-T and Qn+T:
The bargraph field between the above values gets automatically rescaled
and it is additionally marked by a “magnifier” pictogram visible in graph’s
left corner.
• Signalling mass between the value of Qn+T and Qn+T2:
• Signalling mass above the set value of Qn+T2:
17.4.6. „Workspace” bargraph
Setting of bargrap
h type “Workspace” are accessible in submenu
„
Display / Bargraph / Workspace”:
 Loading...