RF Non Signalling Measurements CMU
1100.4903.12 2.12 E-9
Step 4
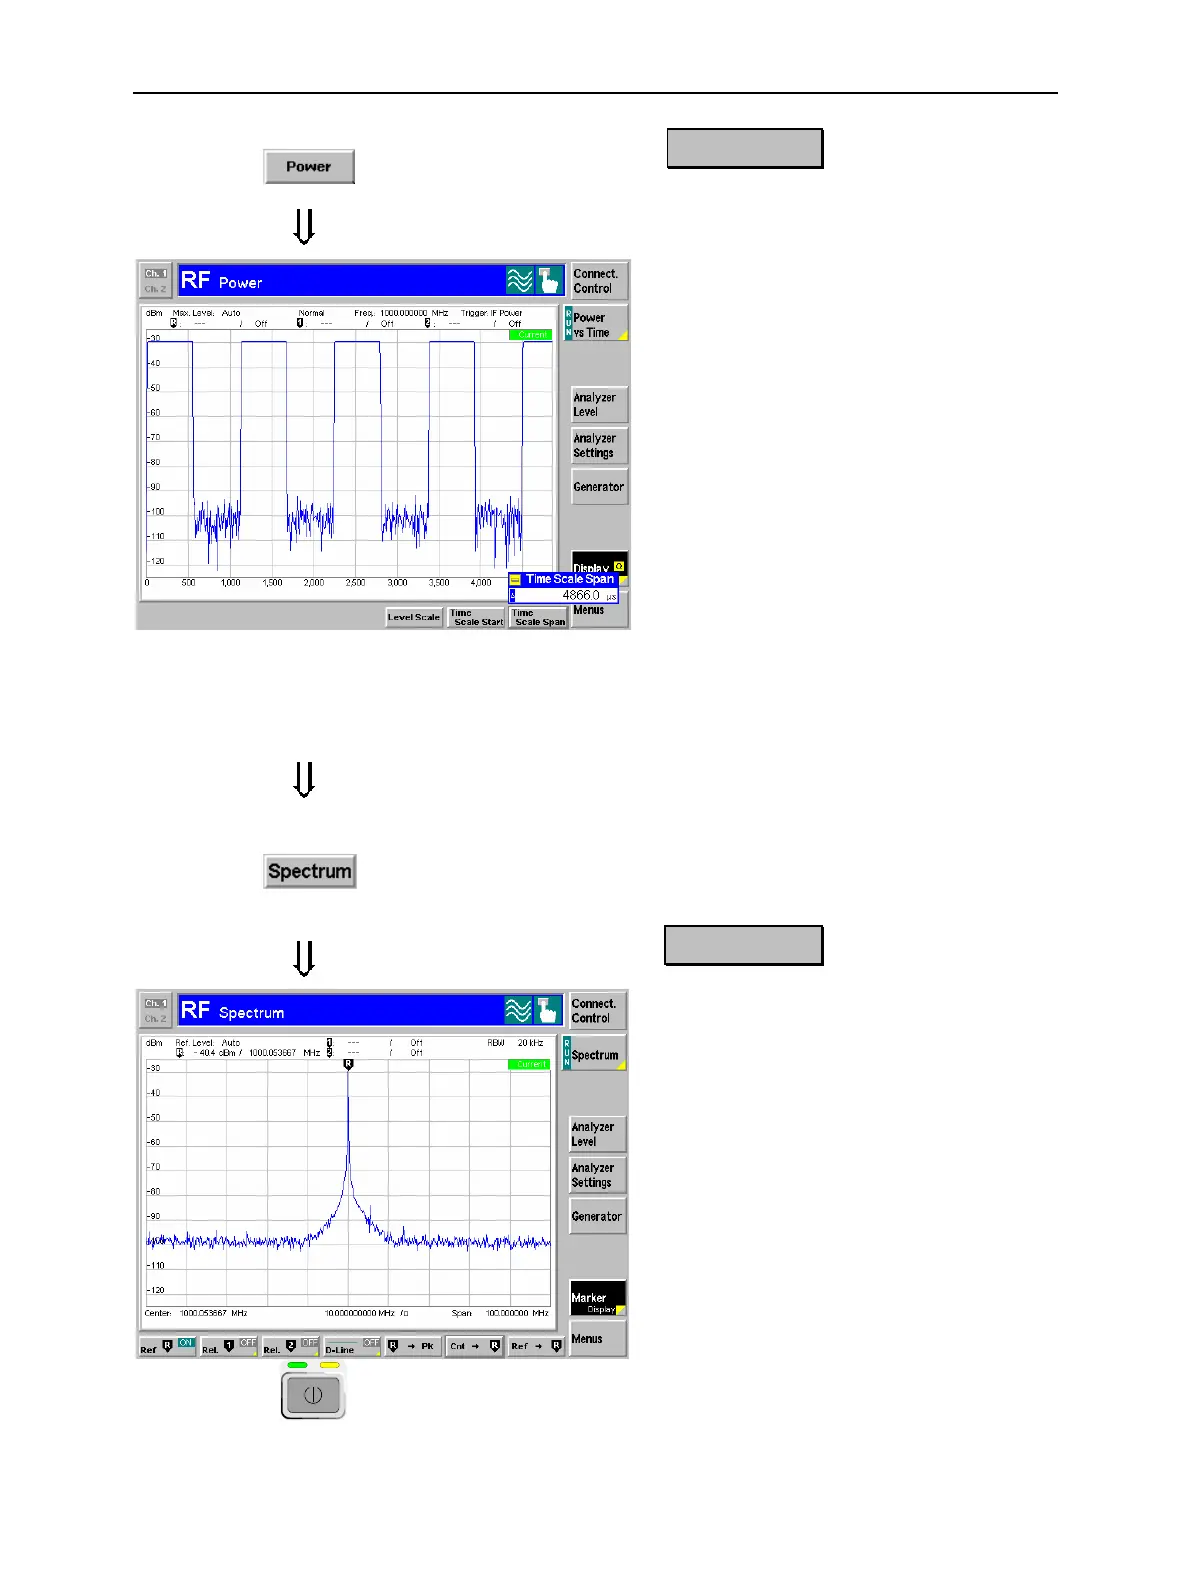
! Press the Power hotkey to switch over
to the graphical menu Power.
The Power menu shows the RF signal
power measured as a function of time at a
particular frequency and resolution band-
width.
An appropriate trigger condition
must be selected to obtain a stable display.
"
Settings (default settings or the ones made
in the Analyzer/Generator menu) and sca-
lar results are displayed in two parameter
lines above the diagram.
Various tools allowing to take a closer look
at the measurement results are provided in
the graphical measurement menu.
#
! Press the Marker/Display softkey twice
and vary the Time Scale to display sev-
eral pulses in the diagram.
! Press the Analyzer Settings softkey and
vary the resolution bandwidth (hotkey
RBW).
$
!
Press the Menu softkey to display the
hotkeys used to change over to the
other measurement menus.
! Press the Spectrum hotkey to switch
over to the graphical menu Spectrum.
Step 5
The Spectrum menu shows the signal
power in spectral representation, i.e. as a
function of the frequency.
The settings and results displayed in the
two parameter lines above the diagram are
analogous to the ones shown in the Power
menu.
! Press the Marker softkey and use the
R to Pk and the Cnt to R hotkeys to
center the diagram.
%
! Press the Analyzer Settings softkey to
scale the diagram and adjust the resolu-
tion bandwidth.
! To close your session set the CMU to
standby mode using the power switch
on the front panel or use the mains
switch at the rear.

 Loading...