Section 9: Dynamics
Euphonix CS3000/2000 Operation Manual 9 - 45
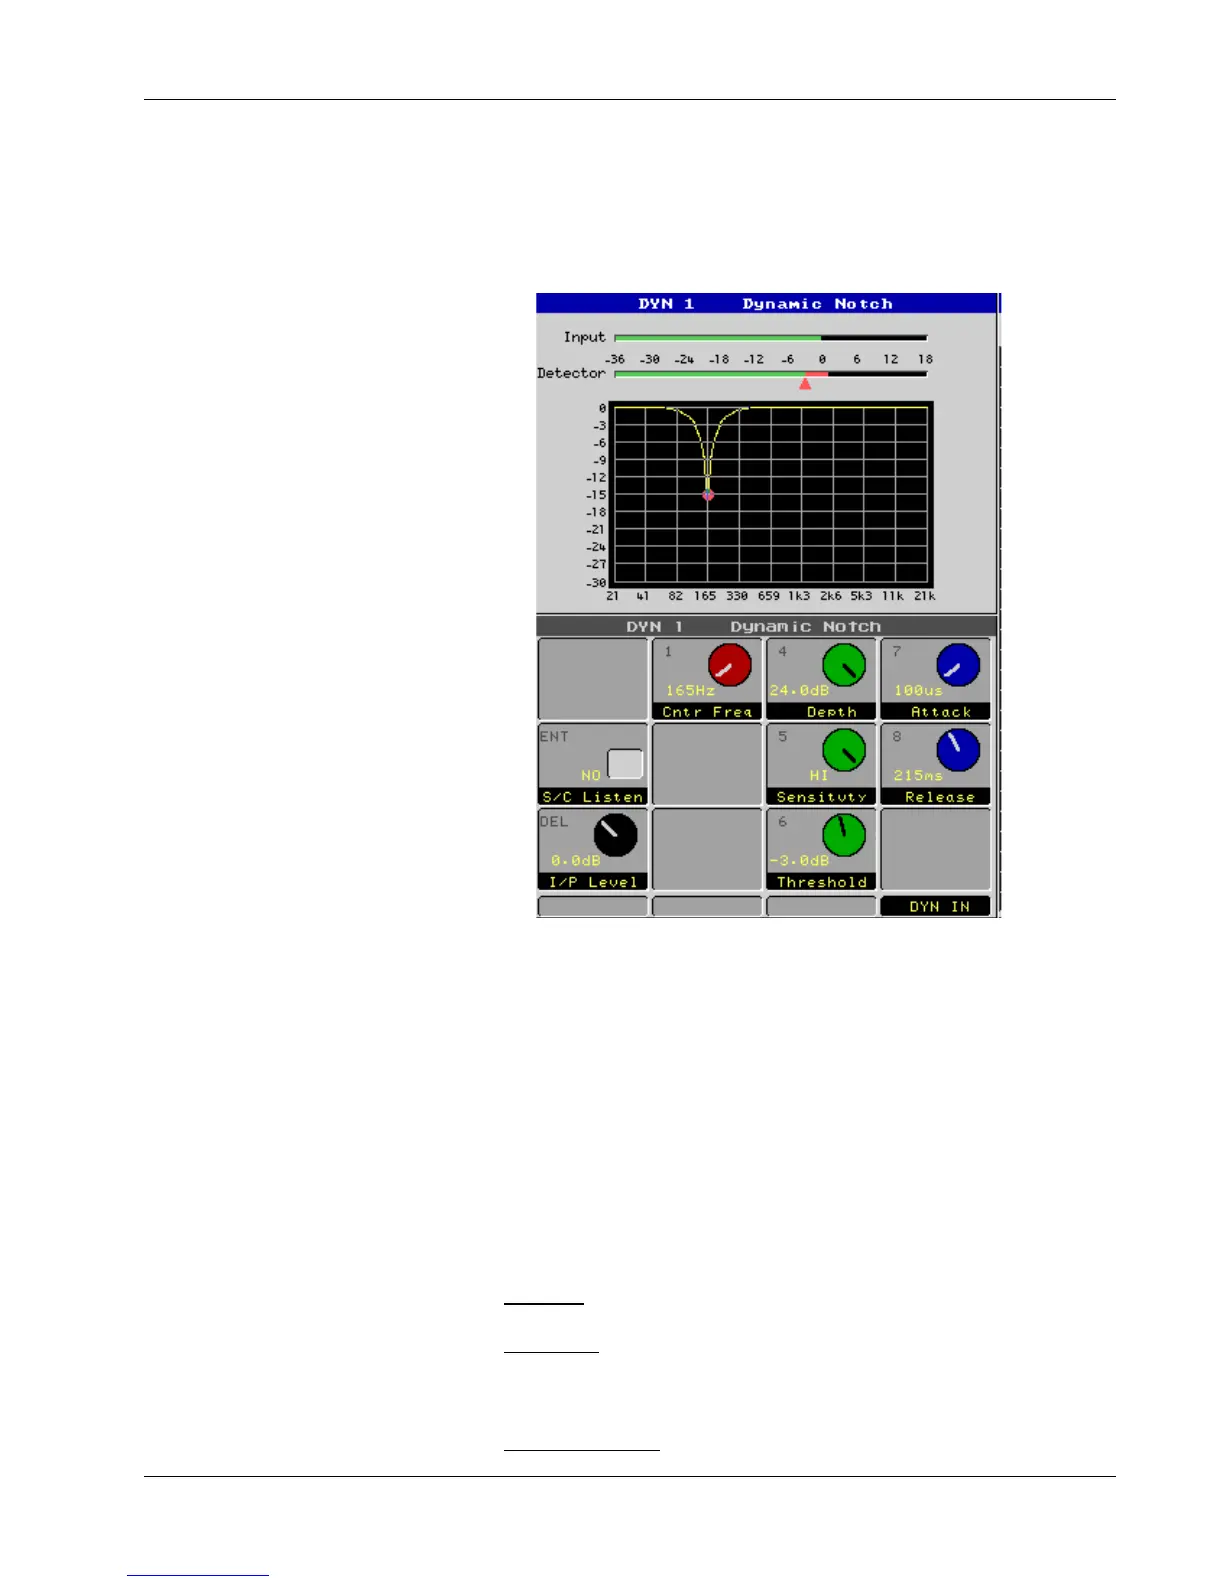
When Dynamic Notch mode is selected, MixView uses a new type of graphic
to illustrate the signal processing activity. Instead of graphing the gain curve
(gain vs. detector level) as in the other dynamics modes, MixView shows a
frequency response curve–more like the EQ graphic. However, the frequency
response curve changes dynamically as the depth of the notch filter varies.
The detector level is shown as a bar meter above the graph, with a threshold
cursor underneath to help the user set the appropriate threshold. The detector
bar turns from green to red when it goes above threshold. Above the detector
meter is an input level meter which shows the pre-filtered amplitude of the
input signal. There is no output meter because it cannot be calculated from the
input level and gain reduction (the gain reduction only occurs at selected
frequencies).
This new display is very intuitive and greatly aids the user in visualizing the
signal processing that takes place when in Dynamic Notch mode.
I/P Level: Input gain (-6dB to +12dB, in 6dB steps).
S/C Listen: Allows you to monitor the side chain signal (post filter) to
optimize triggering.
Center Frequency: Center frequency of notch filter (165Hz to 42.2kHz).
MixView Display
Dynamic Notch Mode
Parameters