Section 4: Tutorial
Euphonix CS3000/2000 Operation Manual 4 - 15
EQ Curves
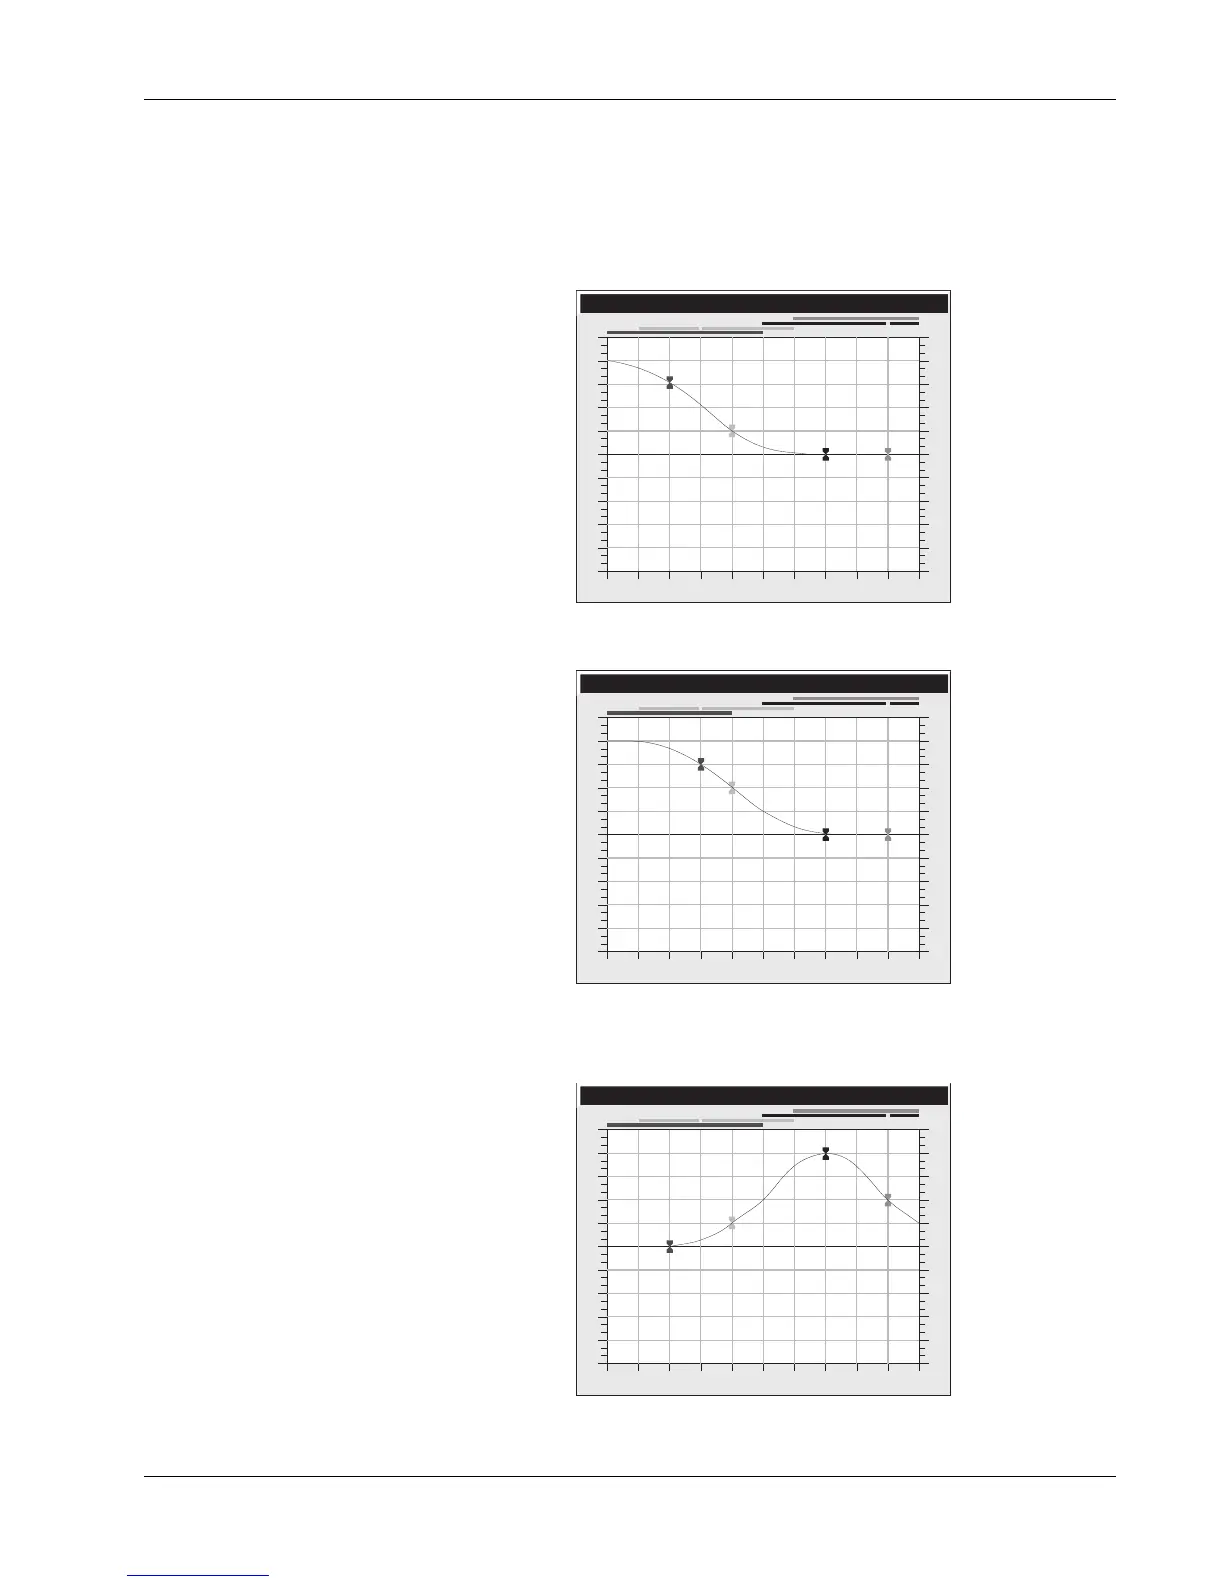
As the EQ parameters are adjusted, the graph instantly displays an accurate
representation of the EQ response curve. The illustration below shows the low
gain increased to +12dB at 82.4Hz. Note that +12dB refers to the
infinite limit
of the EQ boost (the horizontal asymptote to the curve) and not to the amount
of boost at the actual filter cut-off frequency. This is typical of an analog EQ.
Changing the low frequency to 165Hz will change the curve as seen below:
Press the DSC [Clr] key to clear the EQ and boost the upper-mid gain by 12dB
@2.64kHz. With the Q value at 0.51, the EQ graph will look like this:
The SmartDisplay shows the parameter values changing in real time as you
adjust the EQ.
15
12
9
6
3
0
3
6
9
12
15
15
12
9
6
3
0
3
6
9
12
15
21 41 82 165 330 659 1.3K 2.6K 5.3K 11K 21K
EQ 1 M1
Adjusting Low Gain
+12dB @ 82.4Hz
15
12
9
6
3
0
3
6
9
12
15
15
12
9
6
3
0
3
6
9
12
15
21 41 82 165 330 659 1.3K 2.6K 5.3K 11K 21K
EQ 1 M1
Adjusting Low Gain
+12dB @ 165Hz
15
12
9
6
3
0
3
6
9
12
15
15
12
9
6
3
0
3
6
9
12
15
21 41 82 165 330 659 1.3K 2.6K 5.3K 11K 21K
EQ 1 M1
Adjusting Upper-Mid
Gain +12dB @ 2.64kHz