Section 4: Tutorial
4 - 14 Euphonix CS3000/2000 Operation Manual
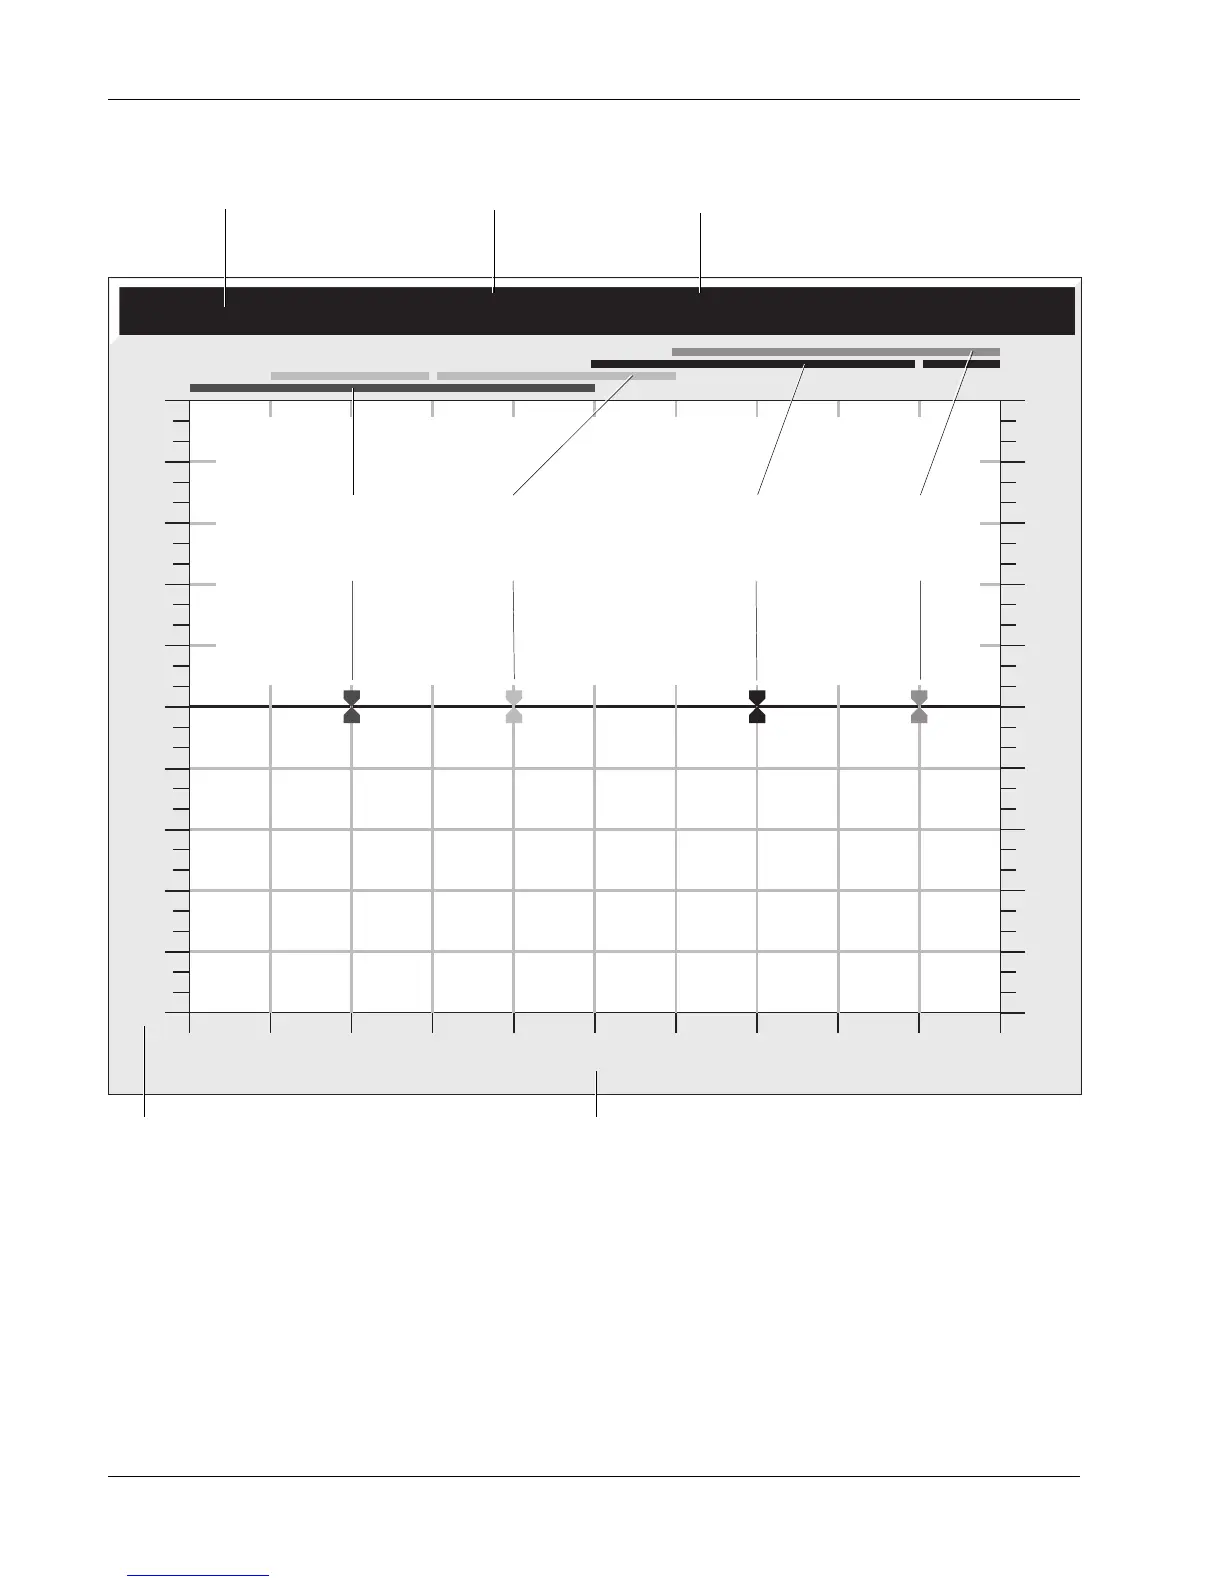
EQ Routing Source
Frequency Range
The frequency range of each of the 4 bands is shown on the screen. The high
mid and the low mid have extended ranges to allow them to overlap with the
high and low bands, thus making two bands available in the high and low
regions.
When you select a source for the EQ (M1, M2, L1, L2, L3, L4), that source
appears in the EQ graph info bar. If the source is selected but the EQ is by-
passed (“out”), the source appears in parentheses as seen in the diagram
above.
EQ Screen Display
15
12
9
6
3
0
3
6
9
12
15
15
12
9
6
3
0
3
6
9
12
15
21 41 82 165 330 659 1.3K 2.6K 5.3K 11K 21K
EQ 1 (M1)
High Range
(Blue)
Gain/Attenuation in dB Frequency in Hz
Info Bar
Lower Mid-Range
(Yellow)
High Mid-Range
(Green)
EQ(1) or EQ(2)
EQ Routing (bypassed)
Low Range
(Red)