OB/GYN
9-66 LOGIQ 7 Basic User Manual
Direction 2392206-100 Rev. 1
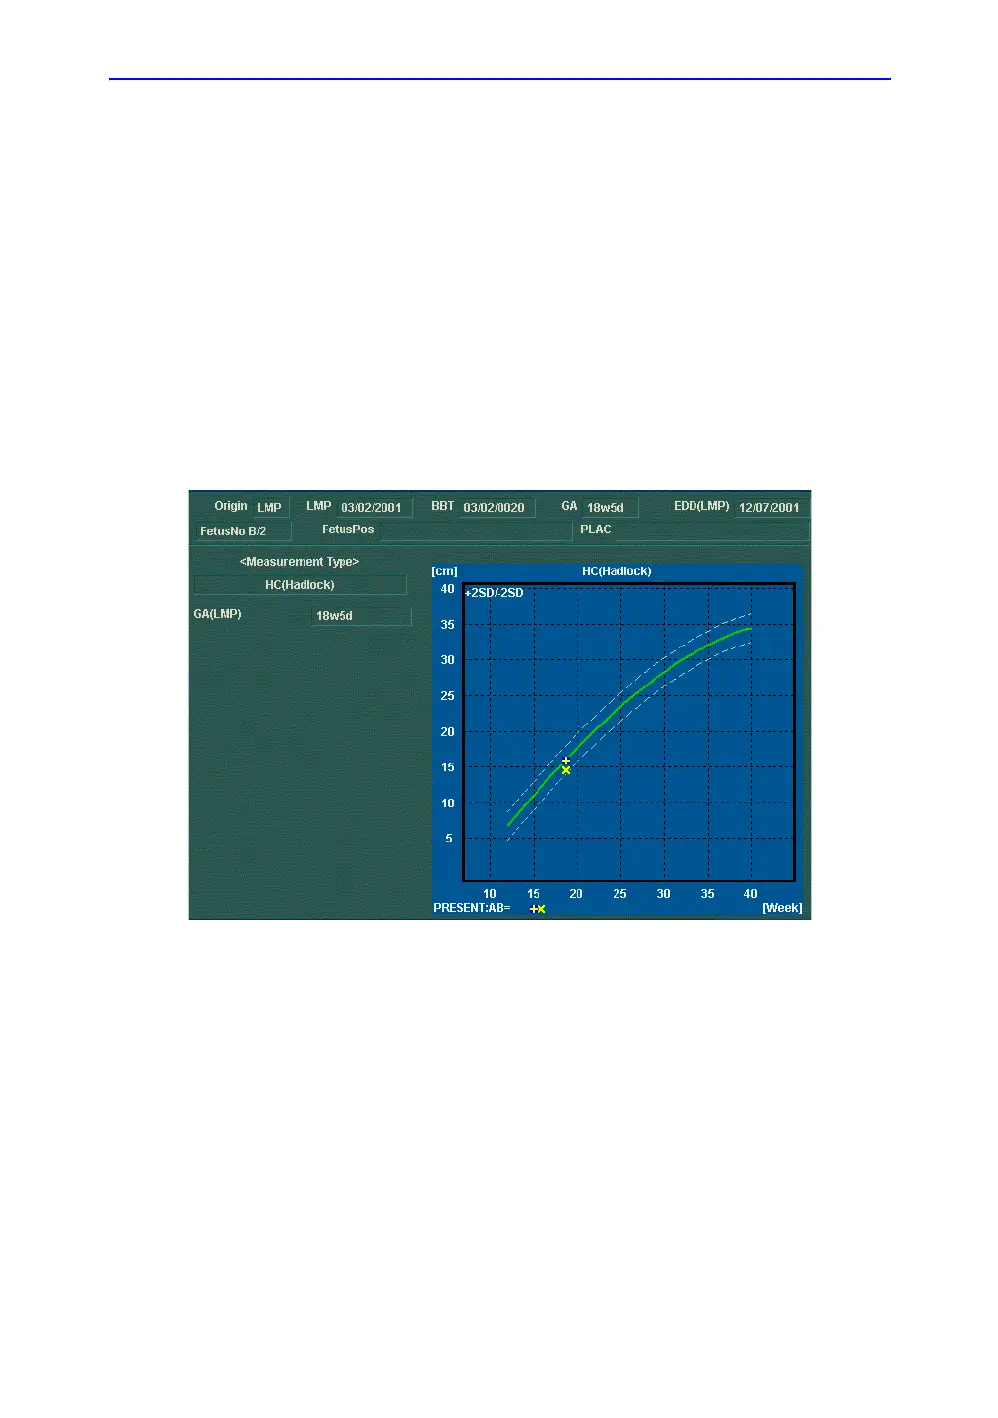
To view multiple fetuses data on graphs
You can view multiple gestation data on fetal growth curve
graphs. After you have made measurements for each fetus,
select Graph Display.
• To view the graph for each fetus, do one of the following:
• Adjust the Fetus knob.
• In the Patient Data section, move the Trackball to
highlight the FetusNo field. In the list of fetuses, move
the Trackball to select the fetus you want, and press
Set.
• To display data for multiple fetuses on the same graph,
select Fetus Compare.
Figure 9-20. Fetal Growth Curve Graph: Fetus Compare
The legend at the bottom of the graph shows the symbols and
colors that represent each fetus.

 Loading...