ReportWriter
14-26 LOGIQ 7 Basic User Manual
Direction 2392206-100 Rev. 1
OB Graph (OB Only)
The OB Graph can be entered into the Report.
1. Insert a table for the OB Graph to the desired locaiton.
2. Move the cursor to the table and press Set.
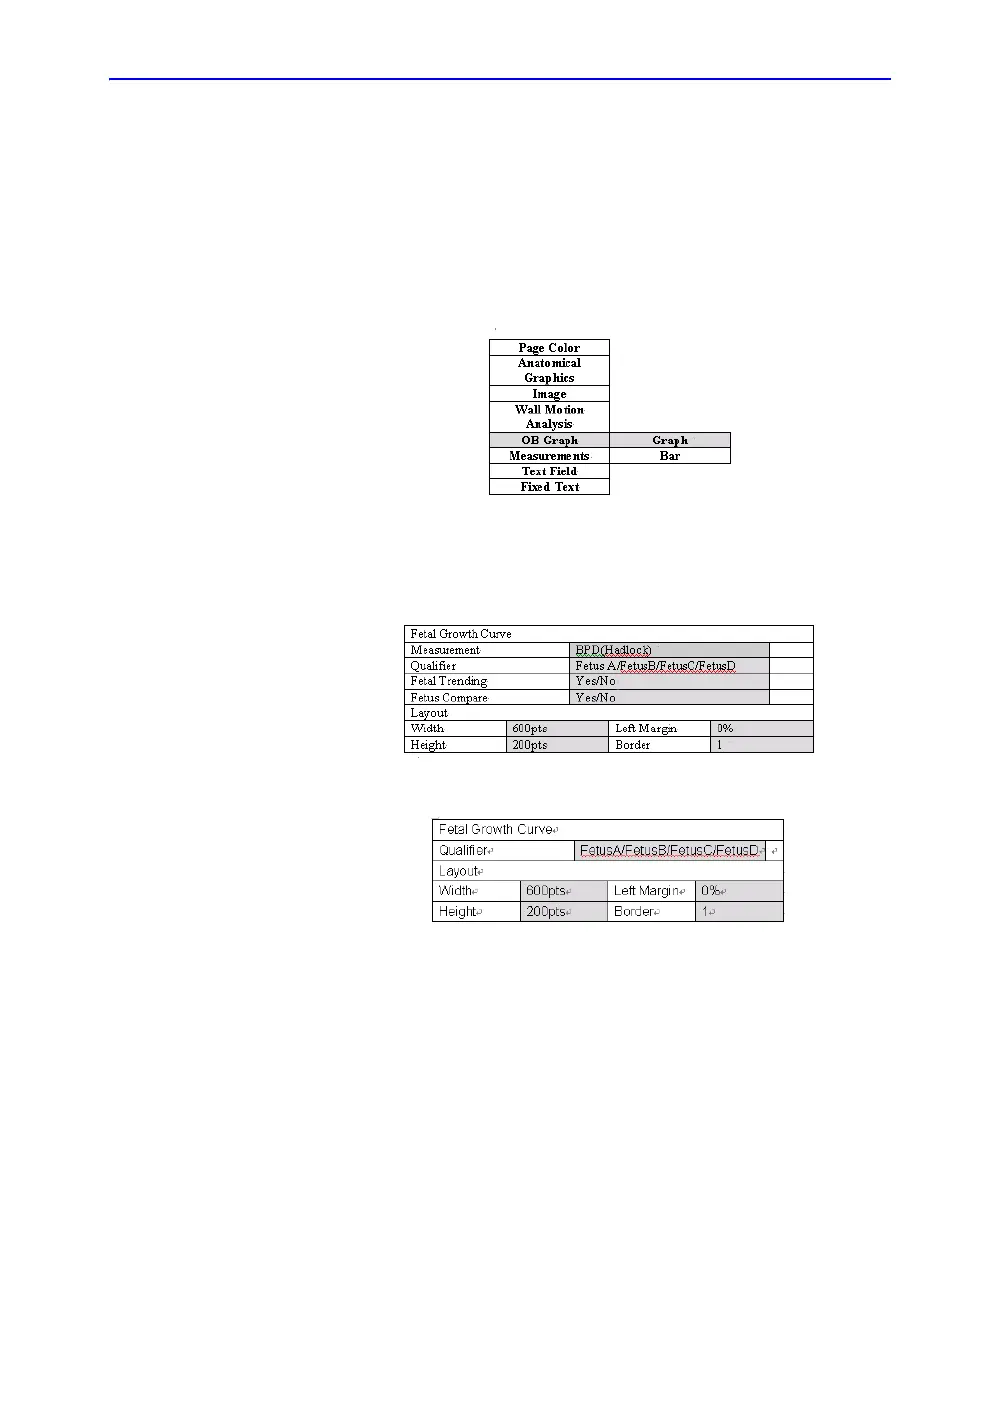
3. Move the cursor to the Customize menu and select OB
Graph. The Graph/Bar selection menu displays.
Figure 14-21. Graph/Bar Selection Menu
4. Select Graph or Bar as necessary.
5. A dialog box displays.
Figure 14-22. Dialog Box for Graph Example
Figure 14-23. Dialog Box for Bar Example
6. Select and set required parameters.
• Select the Measurement from the pull-down menu (only
for Graph)
• Select the Qualifier from the pull-down menu.
• Select Yes or No for Fetal Trending (only for Graph)
• Select Yes or No for Fetus Compare (only for Graph)
NOTE: The Bar Graph contains default application measurements
already.
 Loading...