Chapter 4: Management with WebPAM PROe
97
3. Click the Performance Monitoring icon.
Under the Information tab, you can see:
• Logical Drive Statistics
• Physical Drive Statistics
• Data Port Statistics
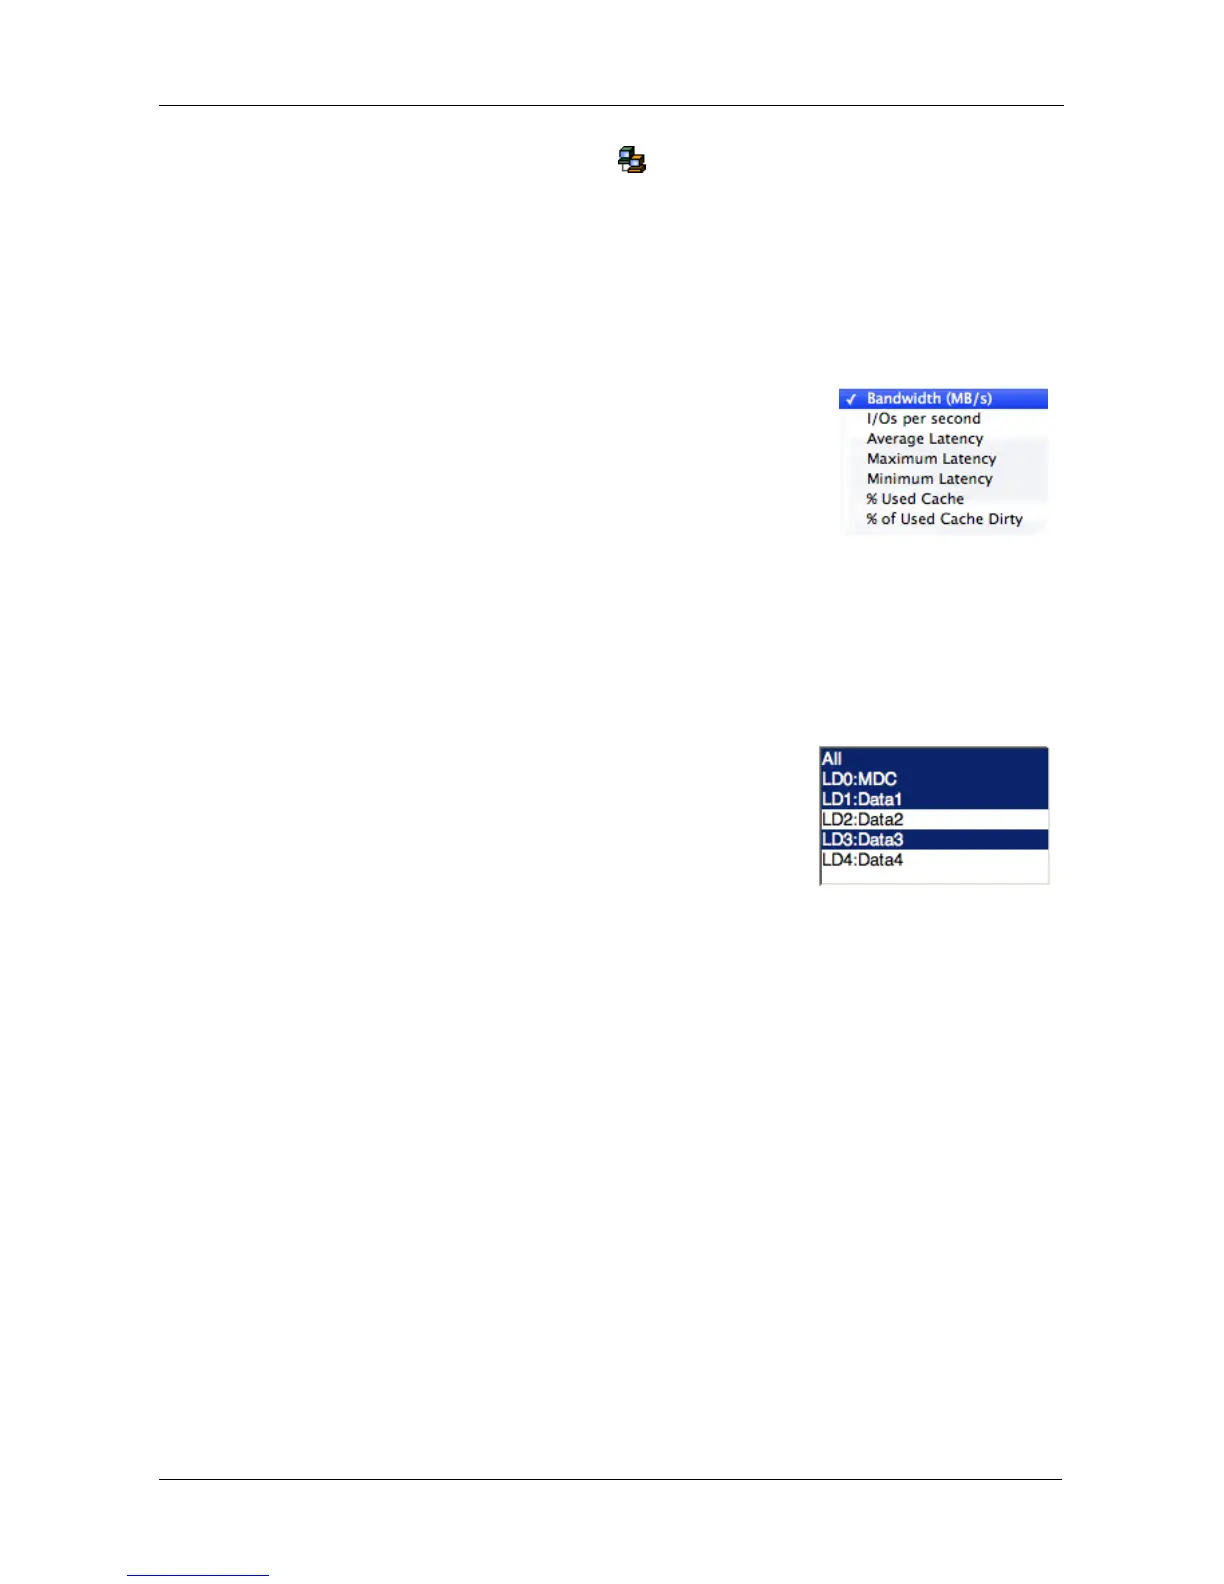
4. From the dropdown menus, choose the measurement you want to see:
• Bandwidth in MB/s
• I/Os per second
• Average Latency
• Maximum Latency
• Minimum Latency
• % Used Cache – Percentage of the controller cache used (logical drives
only)
• % of Used Cache Dirty – Percentage of controller cache used by data
that is not saved to disk (logical drives only)
5. In the device lists, click the devices you want to see in the chart.
You can choose up to 4 devices.
Click a device to choose it.
Click the device again to release it.
For historical reports on the components listed above, see:
• “Viewing Logical Drive Statistics” on page 154
• “Viewing Physical Drive Statistics” on page 133
• “Viewing Fibre Channel Port Statistics” on page 86
• “Viewing SAS Port Statistics” on page 91
See also “Chapter 8: Troubleshooting” on page 307.