TLS-450 Setup and Operation Screens Manual
322
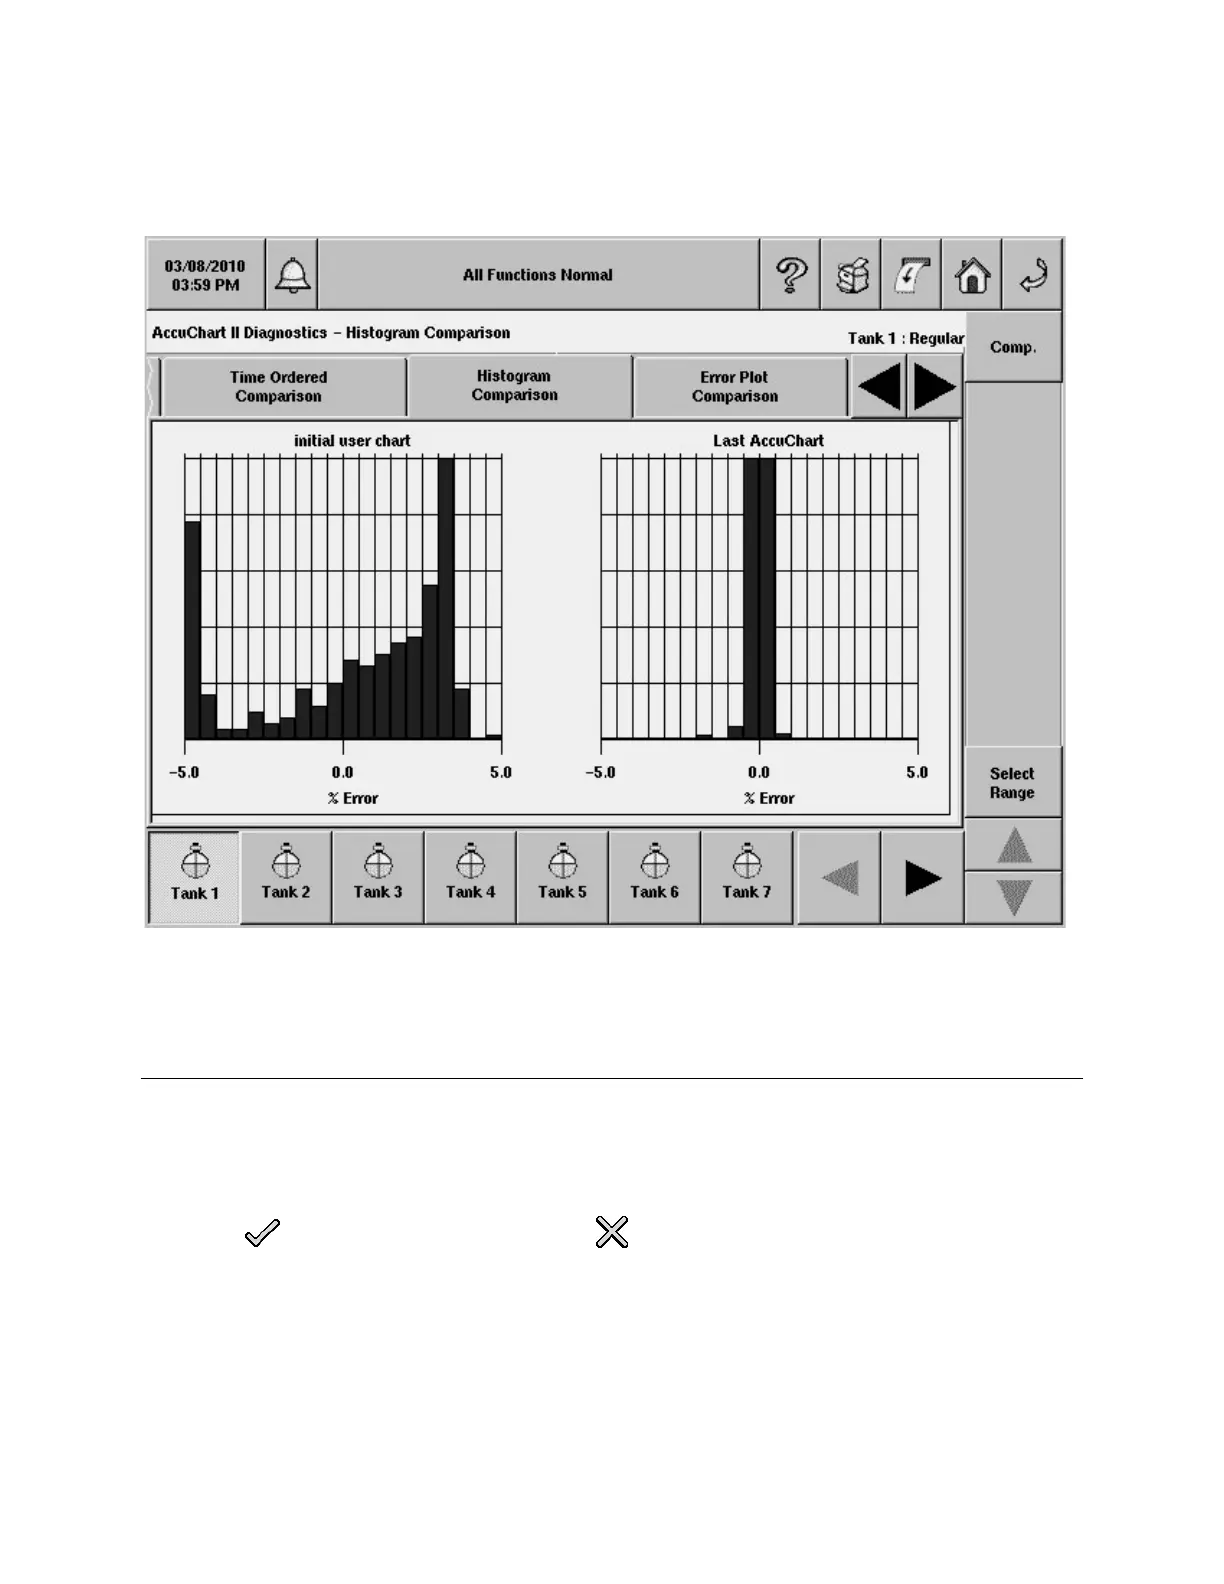
AccuChart II Diagnostics - Histogram Comparison
This screen lets you view a histogram comparison of two charts using the same data from one tank. The
plots depict the accuracy of each of the charts over the tank's operating range - empty to full. The ideal
goal of the calibration is to have one bar on the zero line across the full range of the tank (no error).
Control Buttons (Right side of screen)
Comp.
Touching the 'Compare' button will show the ‘Select Charts to Compare’ dialog. You select the tank charts
to compare from the drop down list beside each field.
Touch the button to accept the selections or button to abort and close the Charts to
Compare dialog box.
Select Range
Pressing the 'Select Range' button will bring up the standard Select Range dialog. This range will be used
to limit the data shown in the report. By default, it will be the last 30 days of reconciliation records.
 Loading...