6-8 PN: 10580-00343 Rev. H S820E UG
6-3 Calculating and Displaying S-Parameters VNA Mode
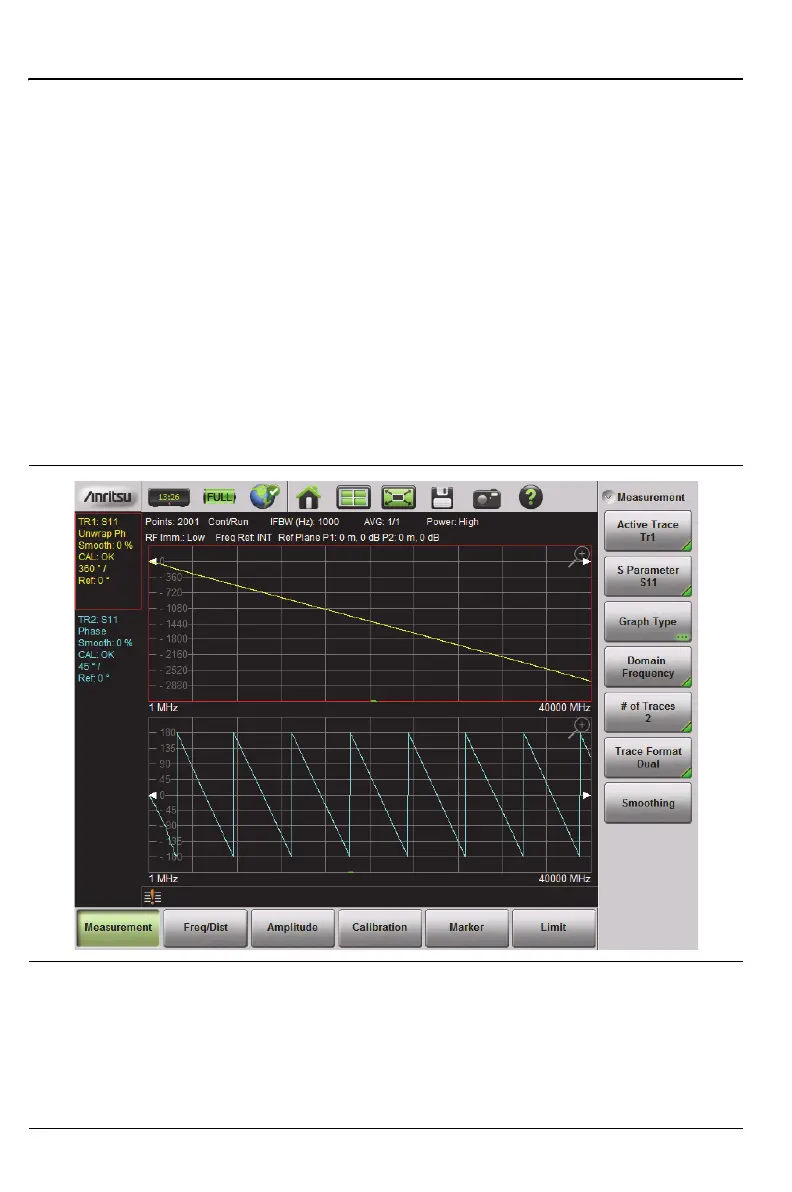
Phase versus Unwrapped Phase Graph Types
Two S
11
measurements are shown in Figure 6-2, one using graph type
Unwrapped Phase, and one using graph type Phase. The standard Phase plot
displays the phase with its natural wrap-around every 360 degrees (or within
a display range of ±180 degrees). The Unwrapped Phase graph removes the
wrapping and plots the phase linearly. Unwrapped phase is obtained by
counting the number of transitions of the phase measurement. Note the
vertical scales of these two measurements in the figure. The Unwrapped
Phase display can be useful for measuring the length of a device in degrees of
phase.
Unwrapped phase will be accurate only if the measurement has enough data
points to capture all of these transitions. Also, the first data point must be
low enough in frequency so that its phase is less than 180 degrees from DC,
otherwise the unwrapped phase measurement will have errors.
Figure 6-2. Unwrapped Phase Compared with Phase