Optimizing B-Mode
LOGIQ 7 Online Help 5-39
Direction 2392536-100 Rev. 1
TIC Analysis Screen Description
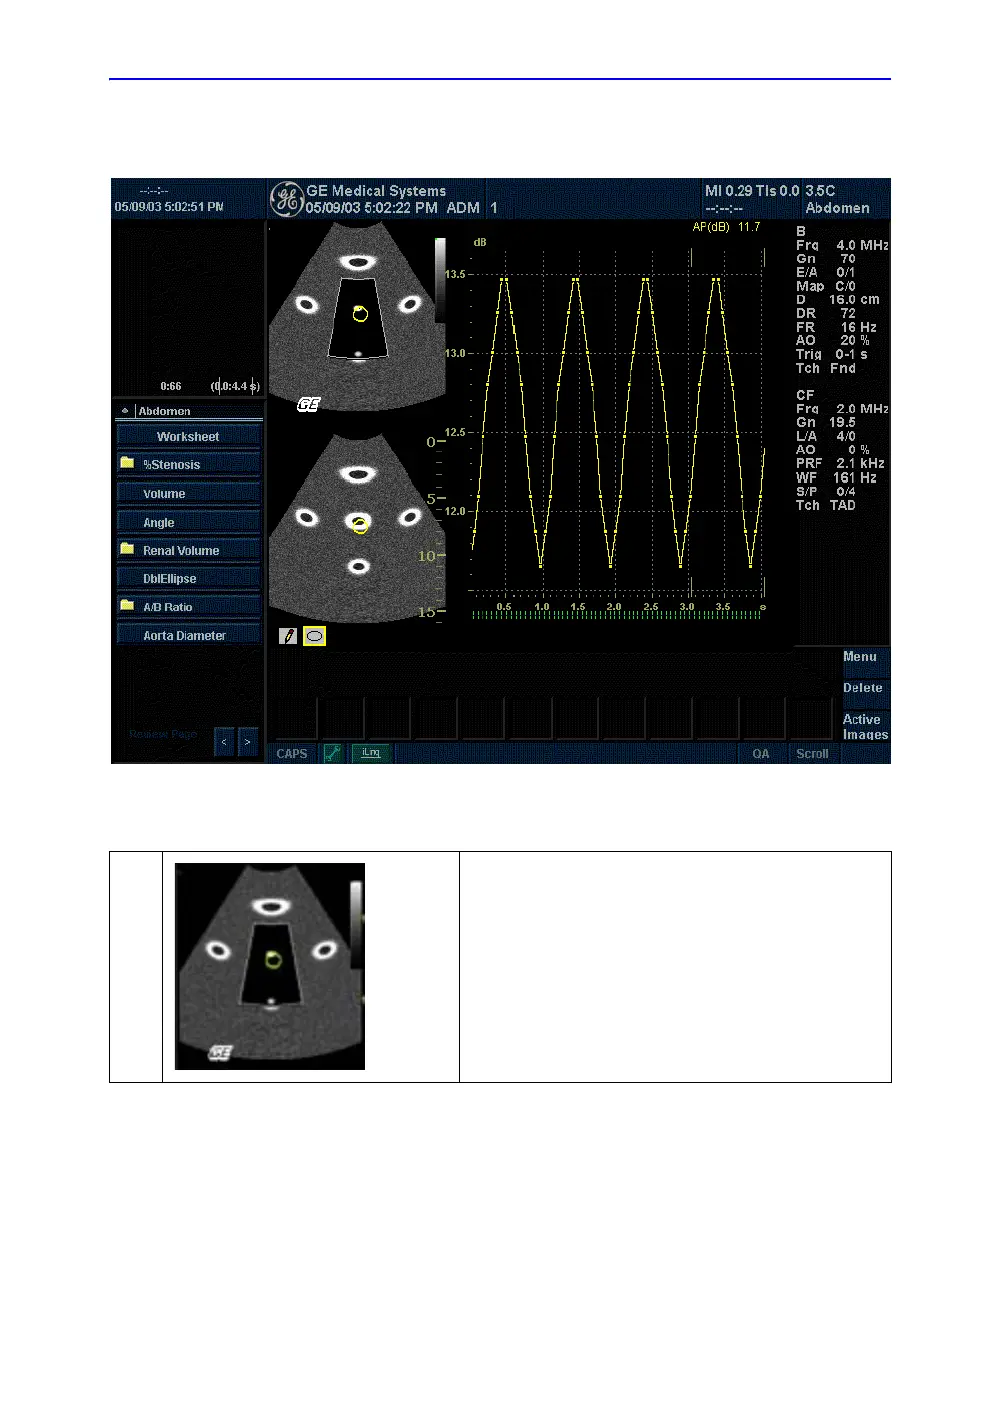
Figure 5-13. TIC Analysis Screen (TAD mode)
Table 5-5: TIC Analysis Screen Description
1.
Contrast Cineloop Window
Sample Area: Indicates sampling position of the intensity
(Contrast) trace. The sample area is color-coded: the first
sample area is yellow, the second green, etc.
 Loading...