Optimizing the Image
5-40 LOGIQ 7 Online Help
Direction 2392536-100 Rev. 1
2.
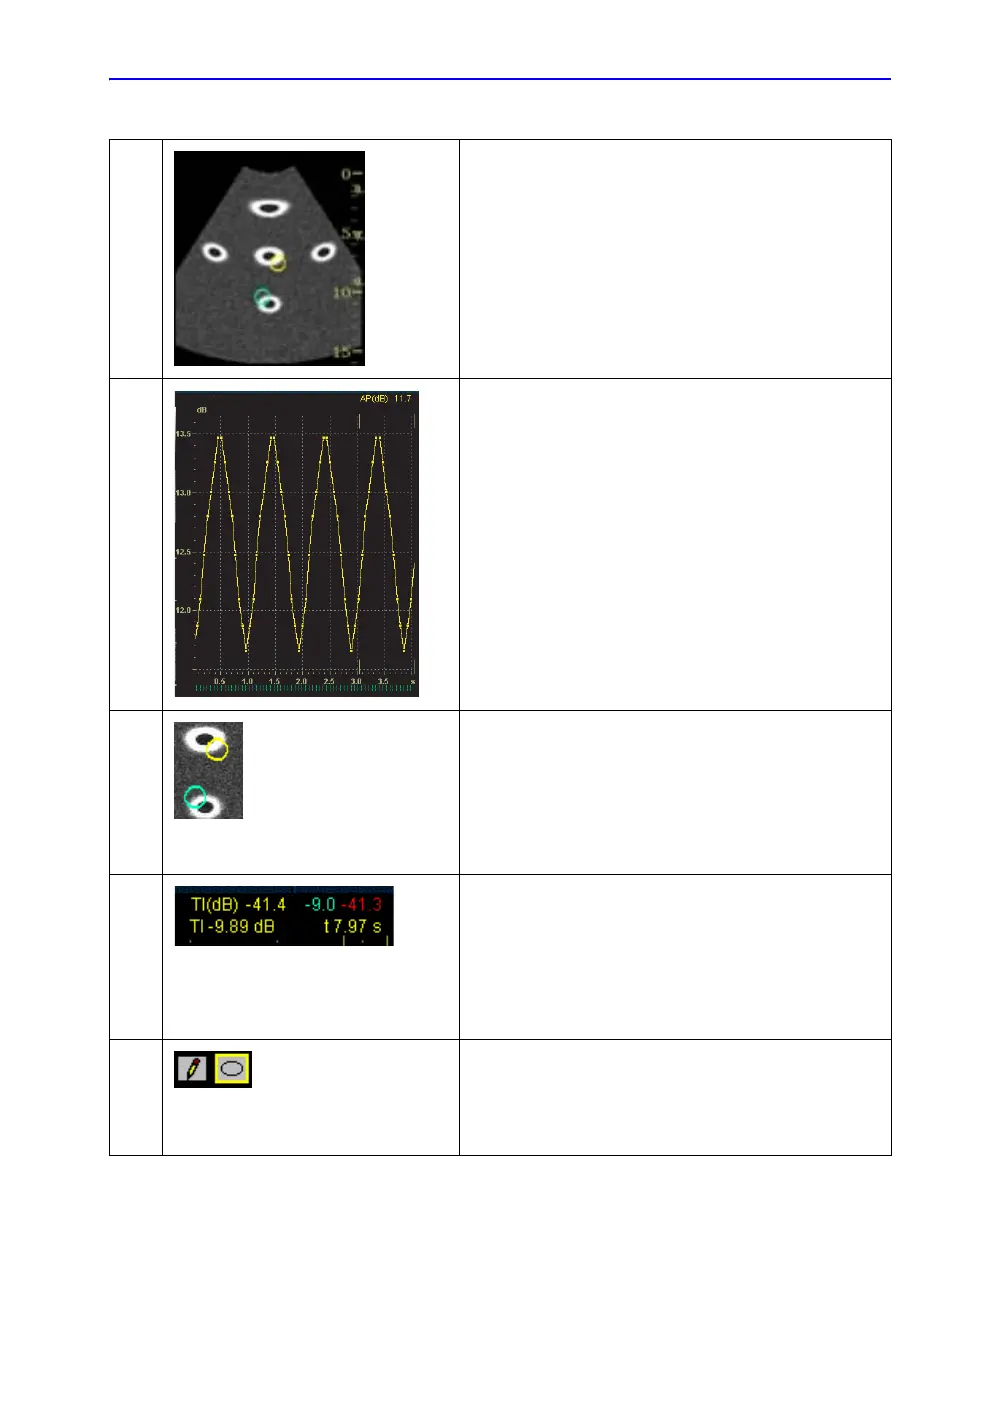
B Cineloop Window
Sample Area: Indicates sampling position of the intensity
(B) trace. The sample area is color-coded: the first sample
area is yellow, the second green, etc.
3.
Displays time-intensity curve.
• Y axis: Intensity scale (logarithmic) (db) or linear
acoustic units (AU).
• X axis: Time(s) or Dt(s), elapsed time from previous
frame.
• ECG (not shown), Frame Maker : displays ECG trace,
the current frame maker and the start and stop markes
for the cineloop.
• Time at cursor position.
• Intensity (dB or AU) at Cursor position.
• Intensity (dB or AU) at frame marker position (Color
coded)
4.
Sample Area
5.
Time at cursor position and velocity at cursor position.
6.
Sample Area Tools.
• Pencil Icon : Creates a sample area based on freehand
drawing.
• Shape Icon : Creates a sample area with a pre-defined
circular/ellipse shape.
Table 5-5: TIC Analysis Screen Description
@
A
B
CDE
 Loading...