Optimizing the Image
5-52 LOGIQ 7 Online Help
Direction 2392536-100 Rev. 1
TIC Plot Control (continued)
Vertical auto-
scaling
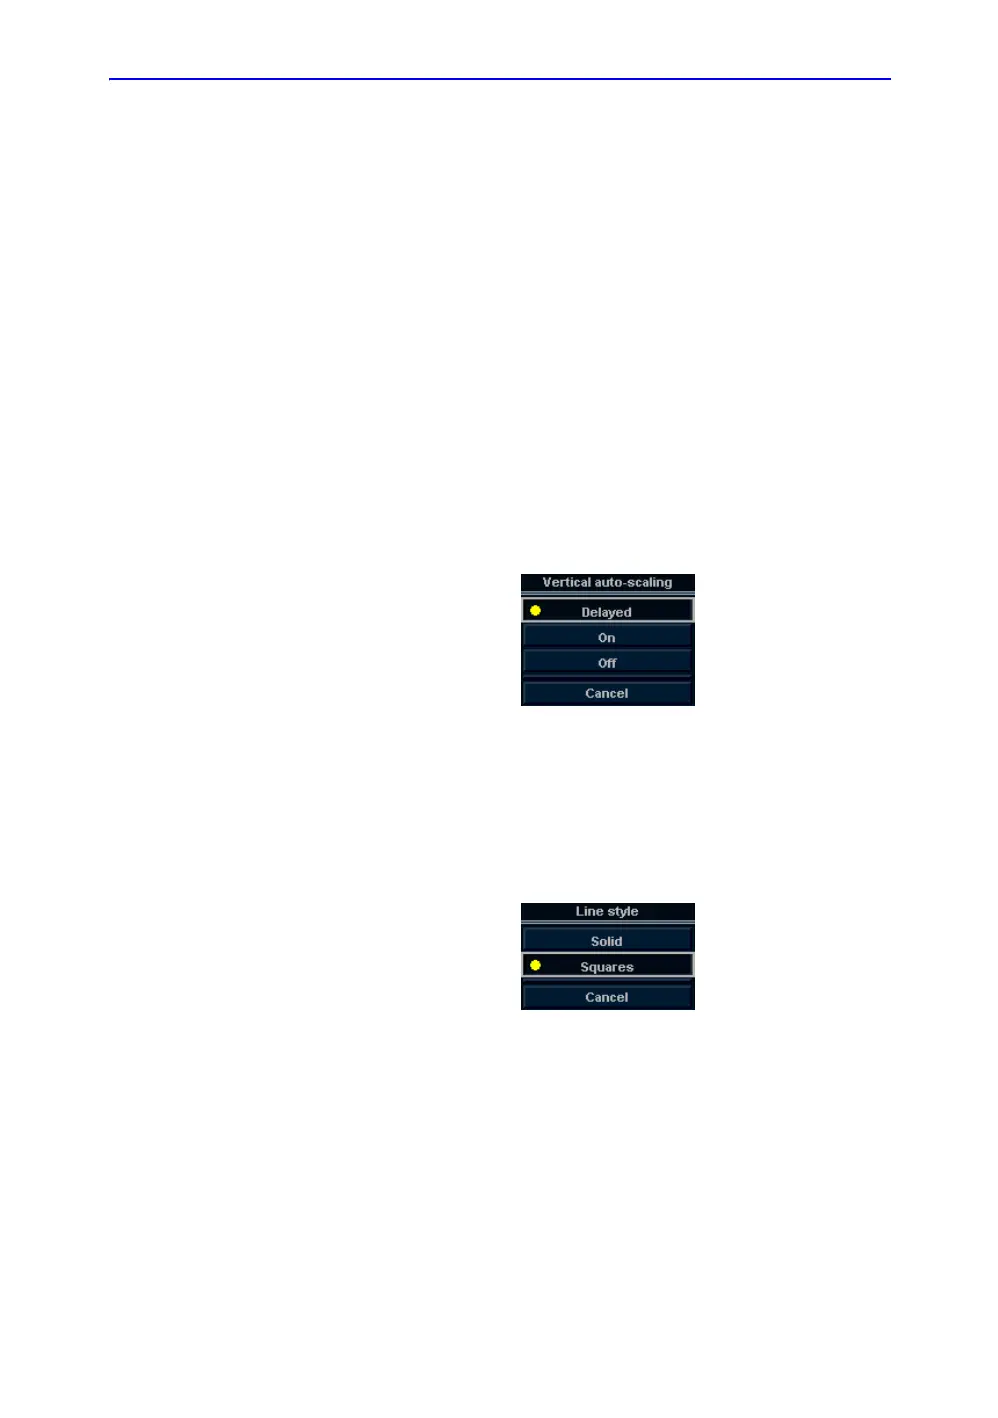
The system can be configured to display the full unit range or a
range according to the maximum and minimum values of the
displayed trace(s) (auto-scaling function). In addition, the auto-
scaling function can be set to be live update (updates while the
sample area is moved) or delayed (updated when the sample
area is anchored).
• Delayed—The system automatically rescale the vertical
axis of the trace graph only when a new ROI is saved, to
account for changing input dynamic range.
• On—The system automatically rescale the vertical axis of
the trace graph every time the currently selected (active)
ROI is moved.
• Off—Disable any automatic scaling of the vertical axis.
There is user-defined system defaults on the system preset
page for the fixed vertical scale to be used for the plot.
Figure 5-23. Vertical Autoscale Pop-up menu
Line Style • Solid—Setting the results in a plotted trace that does not
display small boxes at the data points
• Squares—Setting the results in a plot where small squares
are displayed at each data point, and the squares are linked
together by lines.
Figure 5-24. Line style Pop-up menu
 Loading...