Optimizing B-Mode
LOGIQ 7 Online Help 5-55
Direction 2392536-100 Rev. 1
Curve Fit
1. Select Curve Fit.
OR
Position the cursor over the analysis window and press the
left Set key. The system menu displays at the cursor
position. Select Curve Fit.
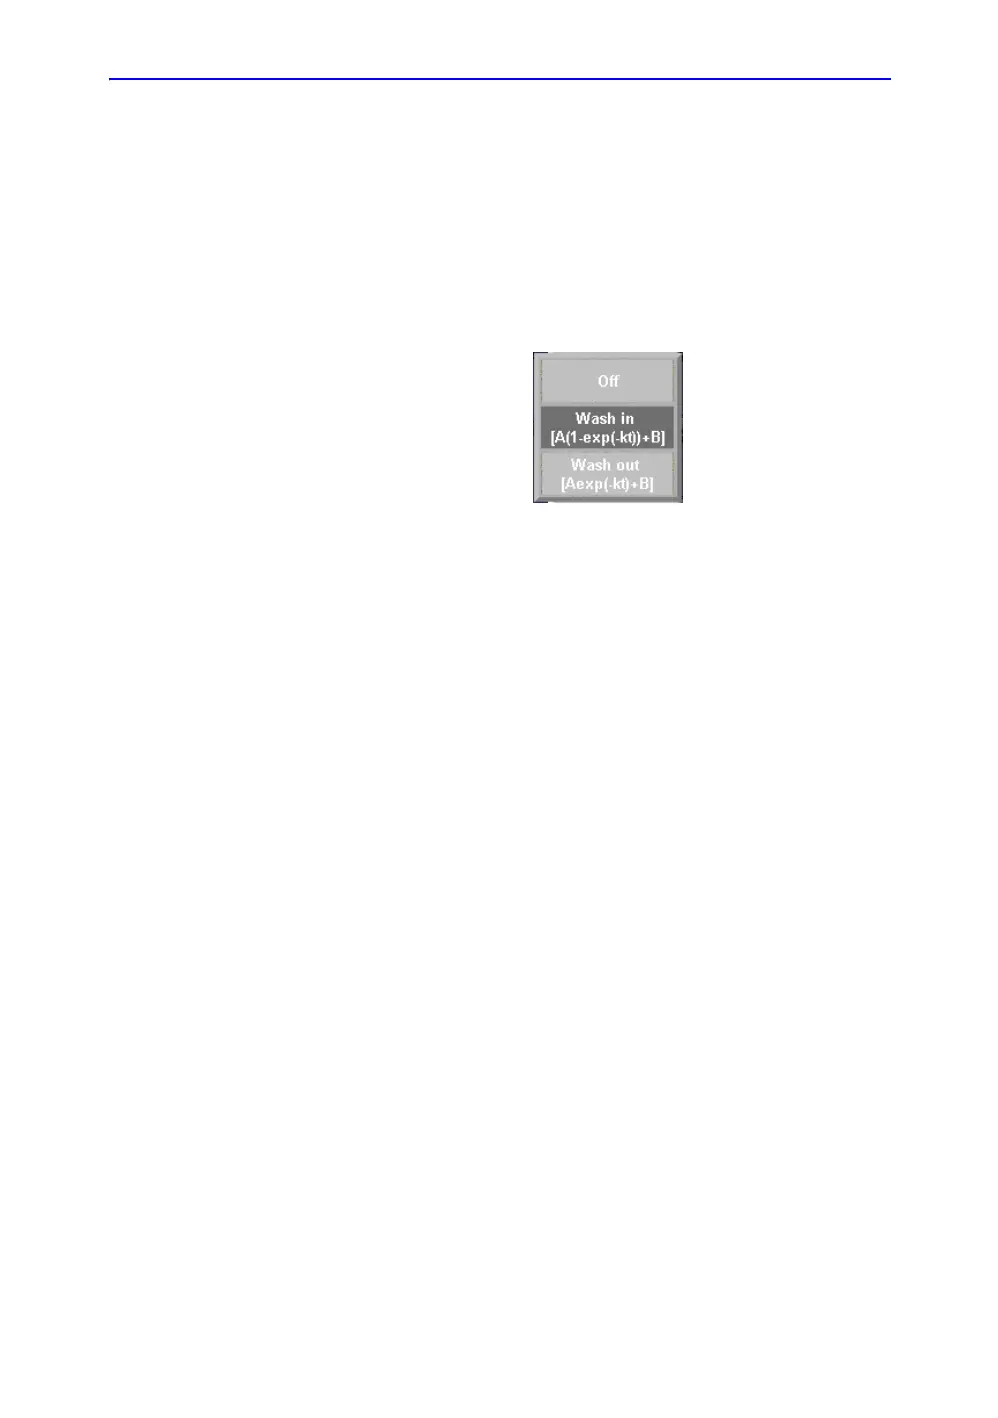
2. The Curve Fit selection list displays.
Figure 5-28. Curve Fit Selection List
• Off—Remove the fitted curves from the plot and the fit
parameters from the display.
• Wash-in—Used to find and estimate the local perfusion rate
using the contrast agent. Expotential wash-in is described
by the function:
Y(t) = A(1-exp(-kt))+B, where :
• A (dB or AU) is the intensity from the contrast agent.
• B (dB or AU) is the intensity at time t=0 (defined as the
time of the left marker). This corresponds to the tissue
(baseline) signal if no contrast is present at the selected
starting point.
NOTE: A + B = contrast + tissue = plateau level.
• k (1/s) is a time constant.
• Wash-out—Used to find and estimate a local wash-out rate.
Expotential wash-out is described by the function:
Y(t) = Aexp(-kt)+B, where :
• A (dB or AU) is the intensity from the contrast agent.
• B (dB or AU) is the intensity from the tissue = baseline
signal.
NOTE: A + B is the initial intensity level.
• k (1/s) is a time constant.
 Loading...