Drive Tuning D2 Series Servo Drive User Manual
6-14 HIWIN MIKROSYSTEM CORP.
(3) Zoom in/out
To observe a more subtle change in a certain interval, use the solid-line and dotted-line cursors to
select the interval needed to zoom in. “Plot vies” provides the function of zoom in/out on the X and Y
axes. The related icon and the operation method on the main toolbar area is described as follows.
-
: Zoom in on the graph between the blue solid-line and dotted-line cursors on the X axis.
-
: Undo zoom.
-
: Redo zoom.
-
: Cancel all zoom-in displays.
- : Zoom in the graph between the red solid-line and dotted-line cursors on the Y axis.
-
: Cancel the zoom-in action on the Y axis.
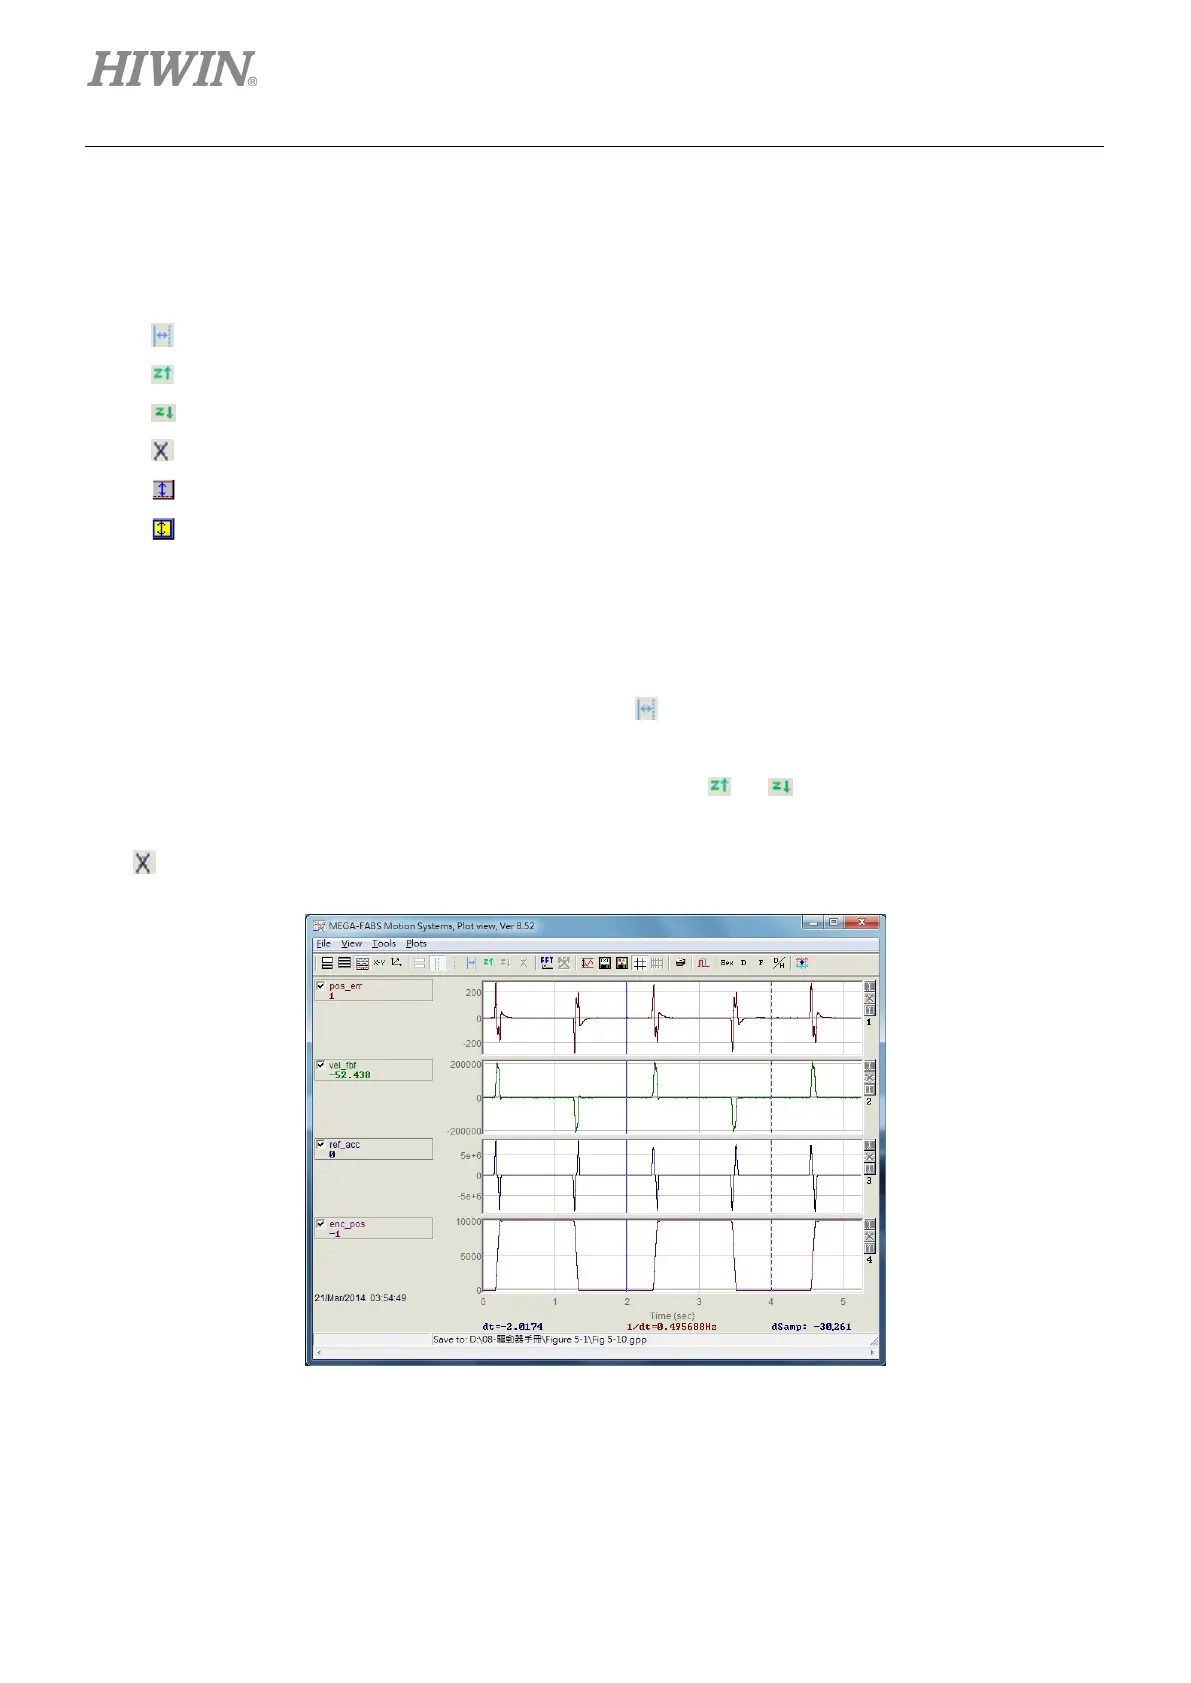
(4) Zoom in/out on the X axis
To zoom in on the graph of physical quantity ranging from 2 to 4 seconds, as shown in figure 6.5.1.3,
use the left mouse button to move the blue solid-line cursor or the right mouse button to move the
dotted-line cursor to frame this interval. Then, click
to zoom in on this interval, as shown in figure
6.5.1.4. To zoom in a more subtle interval, such as 2 - 3 seconds, simply repeat above steps. To go
back to zoom-in interval between 2 and 4 seconds, click
. If is clicked, the zoom-in interval
between 2 and 3 seconds will be displayed again. Regardless of how many times users zoom in, use
to revert to the original graph, as shown in figure 6.5.1.3.
Figure6.5.1.3
 Loading...