Appendix A: Installation and Setup
Linx 4900 Operating Manual 168 MP65492–1
Step 3: Check the Calculated Print Performance
Any difference between the required raster pitch and the actual raster pitch
influences the print performance. There is also a limitation due to the
frequency of the encoder signals.
This step requires that you do the following:
1. Calculate the length of the printed message
Number of Rasters (Step 1) x Actual Raster Pitch (Step 2).
2. Calculate the maximum line speed for the message type
Actual Raster Pitch (Step 2) x Raster Rate (kHz). See Figure A-9 on
page 165 and Figure A-10 on page 165.
The raster rate varies with printhead type and raster.
3. Calculate the maximum encoder speed
Encoder Pitch (Figure A-11 on page 166) x Specified Frequency
(kHz).
NOTE: The Limiting Signal Frequency for Linx standard encoders is
80 kHz.
4. Compare the maximum line speed with the maximum encoder
speed
The maximum line speed must be less than the maximum encoder
speed. If this is not the case, repeat the selection process.
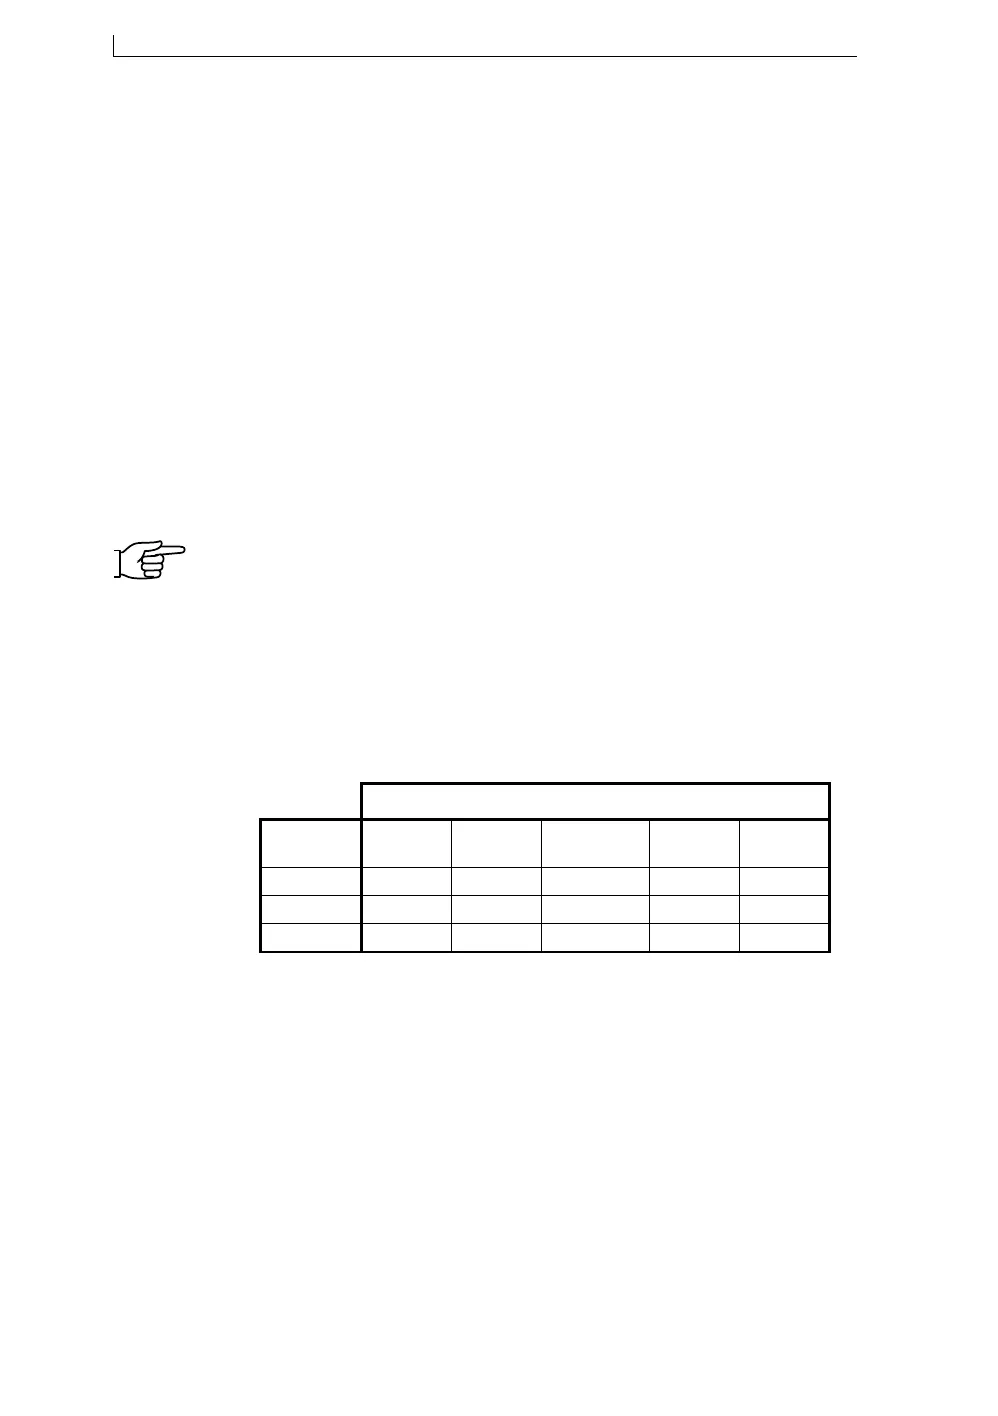
The following table lists the maximum encoder speeds for standard Linx
encoders and wheels:
Figure A-14 Maximum Encoder Speeds for Standard Linx
Encoders and Wheels
Referring back to the example, the actual raster pitch is 0.36 mm (Step 2)
and the number of rasters is 102 (Step 1).
Therefore, this will fit in the target area of 38 mm.
Printed Message Length (mm) = 102 x 0.36 (mm)
= 36.72 mm
68546
Encoder
500 mm
MAXIMUM ENCODER SPEEDS (m/s)
p.p.r.
304.8 mm
333 mm
200 mm 50 mm
2500
5000
10000
16.00
8.00
4.00
10.66
5.33
2.66
9.68
4.80
2.40
6.40
3.20
1.60
1.60
.80
.40
4900 Op Manual.book Page 168 Tuesday, September 9, 2003 12:32 PM