4.
Review the results:
Result Description
Trace Score The average basecall Quality Value (QV) of bases in the clear
range sequence of a trace.
The
clear range
is the region of the sequence that remains
after excluding the low-quality or error-prone sequence at the
5¢ and 3¢ ends. The clear range is calculated by the KB
basecaller using QVs.
CRL The longest uninterrupted segment of bases with an average
Quality Value (QV) ³20.
In addition to evaluating the QV of a base call, the software
considers the QV of adjacent bases within a ±21-bp moving
average to determine a contiguous read length based on
quality values.
QV20+ The total number of bases in the entire trace with Quality
Value ³20.
Trace Score Quality
CRL Quality QV20
Quality
Pass/fail/check determined by the settings in the Basecalling
protocol QV Settings tab.
PUP Score A measure of noise or pull-up that is determined by taking the
mean of the ratios of signal strength calculated for each base-
called peak: (primary peak/secondary peak under the primary
peak).
A higher value indicates less baseline or secondary noise. A
lower value indicates an elevated baseline or secondary noise.
Example 1: Main called base signal strength is 1,000 RFU and
the largest secondary peak beneath it is 10 RFU; PuP=100
Example 2: Main called base signal strength is 1,000 RFU and
the largest secondary peak beneath it is 100 RFU; PuP=10
5.
Review w
arnings:
a.
Scroll to the right of the Metric Analysis table to display the Warning
column.
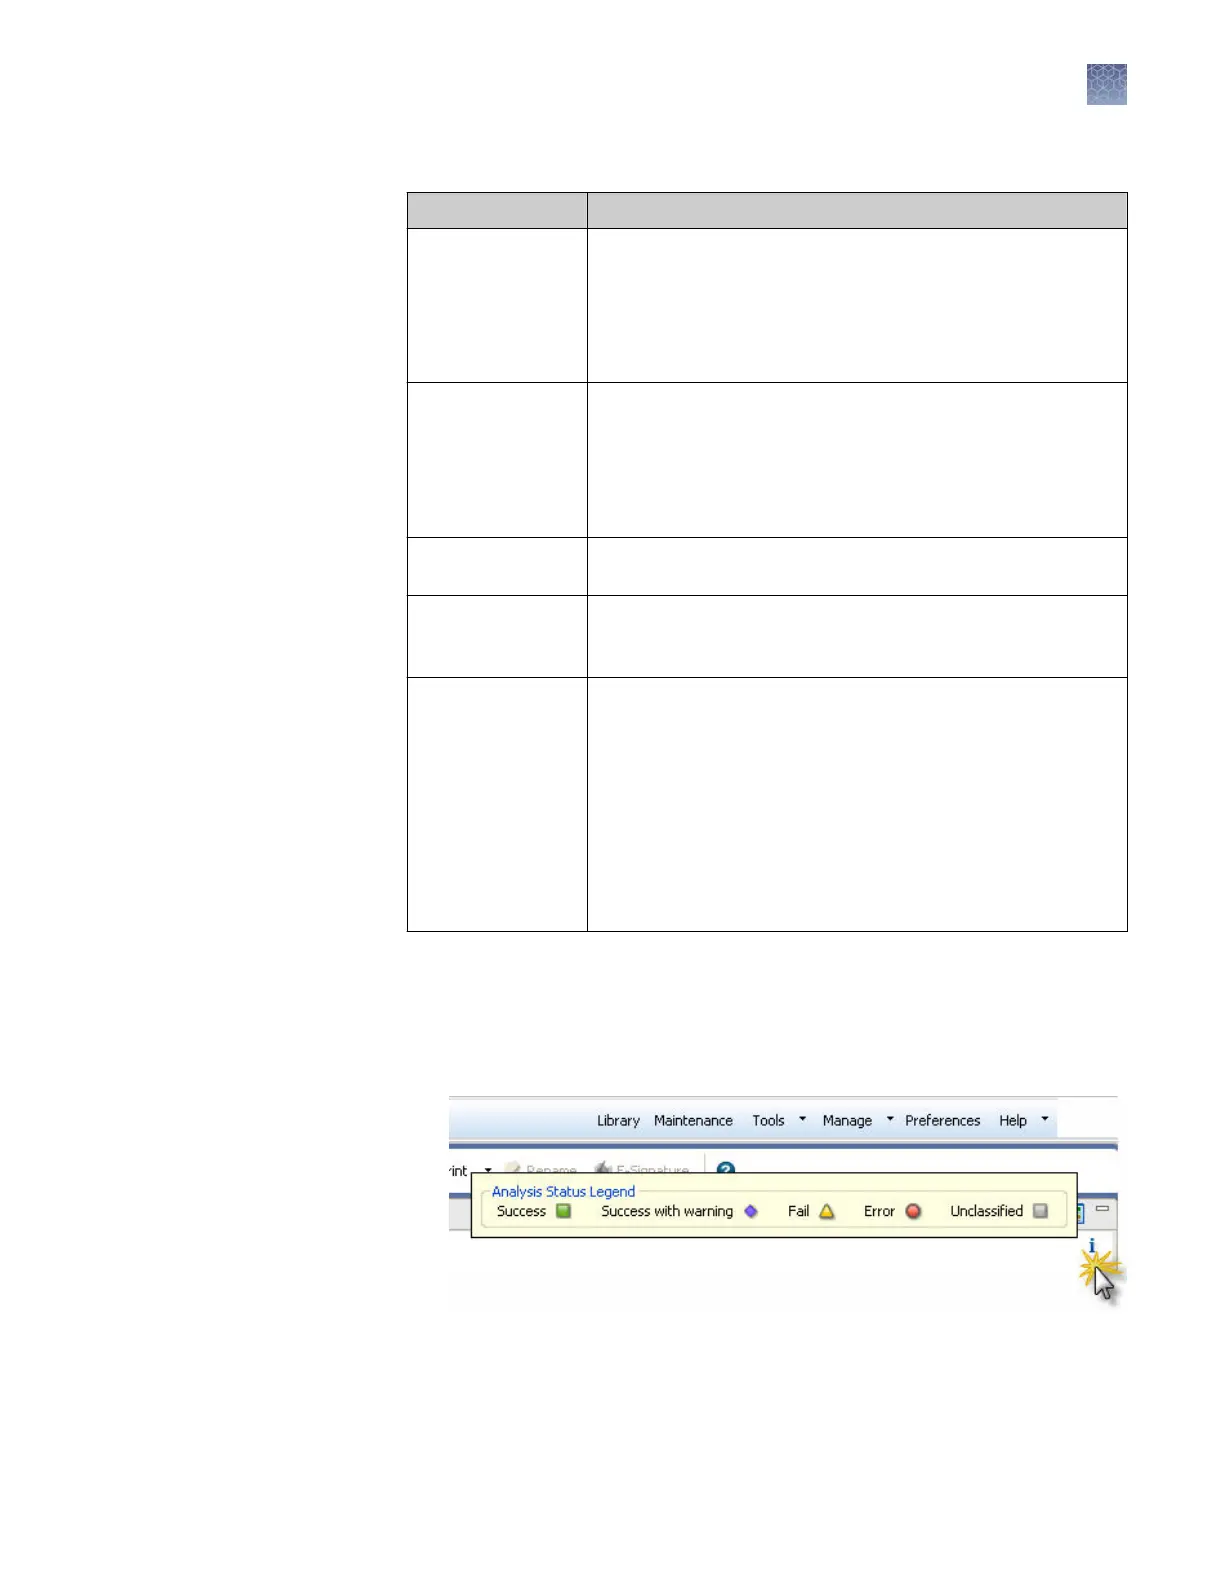
b.
Display the Analysis Status legend.
Chapter 4 Review sequencing results
Review sequence quality
4
3500/3500xL Genetic Analyzer User Guide—Data Collection Software v3.1
85