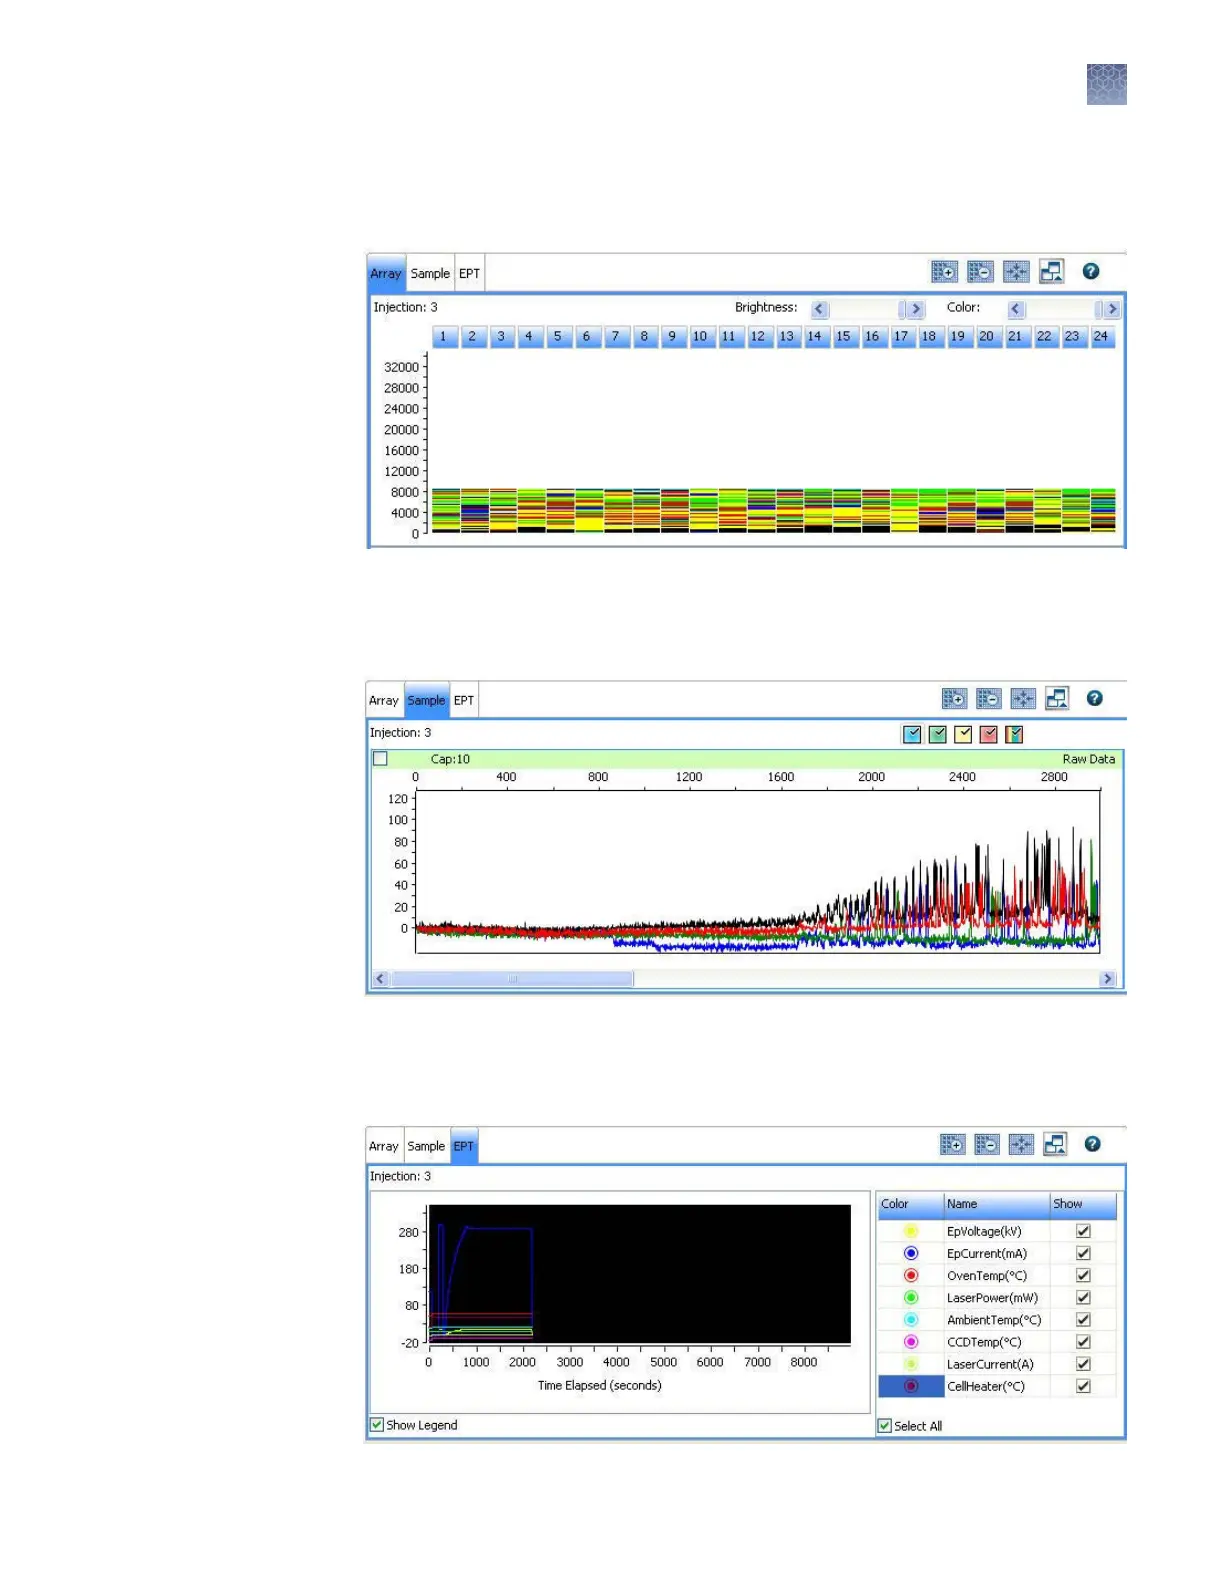
The Array view shows the color data (based on the dominant uorescence color) for
each capillary as a function of instrument scan number (time). Adjust the brightness
and color by using the slider bars abov
e the view.
The Sample view shows the relativ
e dye concentrations as a function of instrument
scan number (time) for the selected capillary. You can select and deselect the dye
colors to display.
The EPT view (ElectroPhoresis Telemetry) shows instrument data conditions (laser
pow
er, temperatures, electrophoresis voltage) as a function of time. In the legend to
the right of the EPT view, you can select and deselect the traces to display in the view.
Array view
Sample vie
w
EPT view
Chapter 3 Set up and run
More features in Monitor Run
3
3500/3500xL Genetic Analyzer User Guide—Data Collection Software v3.1
81