Review plots
1.
Select the samples of interest in the samples table.
2.
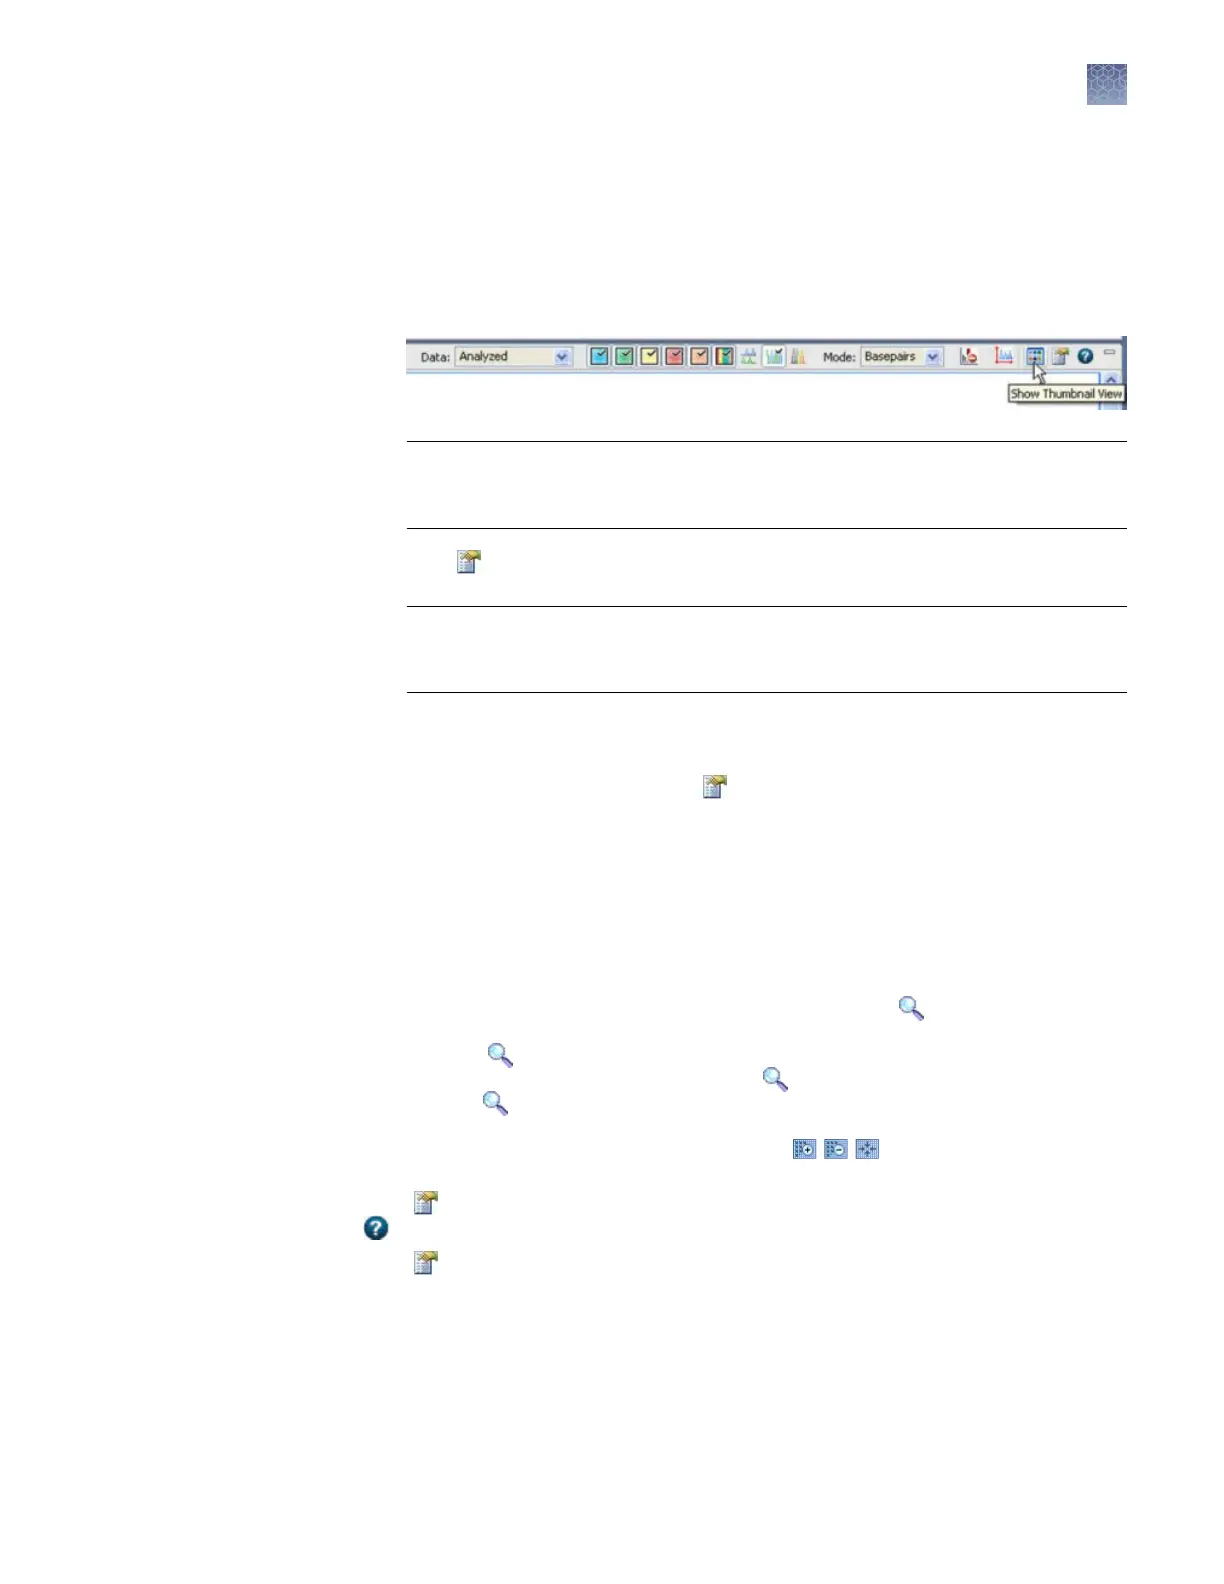
Select items from the plot toolbar to manipulate the plot as needed. Place the
mouse pointer ov
er a buon for the description of the buon.
IMPORTANT! If y
ou rst view a 4-dye sample, then view a 5-dye or 6-dye
sample, you must manually select the fth or sixth dye. It is not automatically
selected when you switch to a 5-dye or 6-dye sample.
3.
Click to apply scaling seings to plots: Enter the range for Y axis and X axis,
then click the Zoom buons.
IMPORTANT! Y
ou must open Plot Seings each time you access the View
Results screen, then click Zoom. Scaling seings are not automatically applied
when you access this screen, or when you click Apply.
To apply scaling seings to all samples in the samples table, select all of the
samples in the samples table to display them in the plot view
, specify the scaling
seings, click Zoom, then click Page Up and Page Down in the plot view to
move through the samples. If the
buon is dimmed, the Plot Seings dialog is
open. Click the 3500 task bar icon, then select Plot Seings.
4.
Display multiple plots as needed: In the Plot Seings Display tab, select
Checkerboard.
5.
Click a peak to label it (to label all peaks, see
“Label peaks“ on page 98).
1.
Place the pointer above the top of the plot or to the left of the plot at the start of the
area you want to zoom, then click to turn the pointer to
.
2.
W
ith the
still above the plot or to the left of the plot, click-drag to the end of the
area you want to zoom. Do not drag the inside the plot area. Doing so
changes back to a pointer and does not zoom as expected.
You can also click zoom and t buons to zoom .
Click (Plot Seings) in the plot view toolbar
. For information on plot seings, click
in the plot seings tabs.
If the buon is dimmed, the Plot Seings dialog is open. Click the 3500 task bar
icon, then select Plot Seings.
Zoom on data
Change plot
settings
Chapter 5 Review fragment/HID analysis results
Review plots
5
3500/3500xL Genetic Analyzer User Guide—Data Collection Software v3.1
97