Interactive Set-Up
46 AX3000 Models 90 - User's Manual
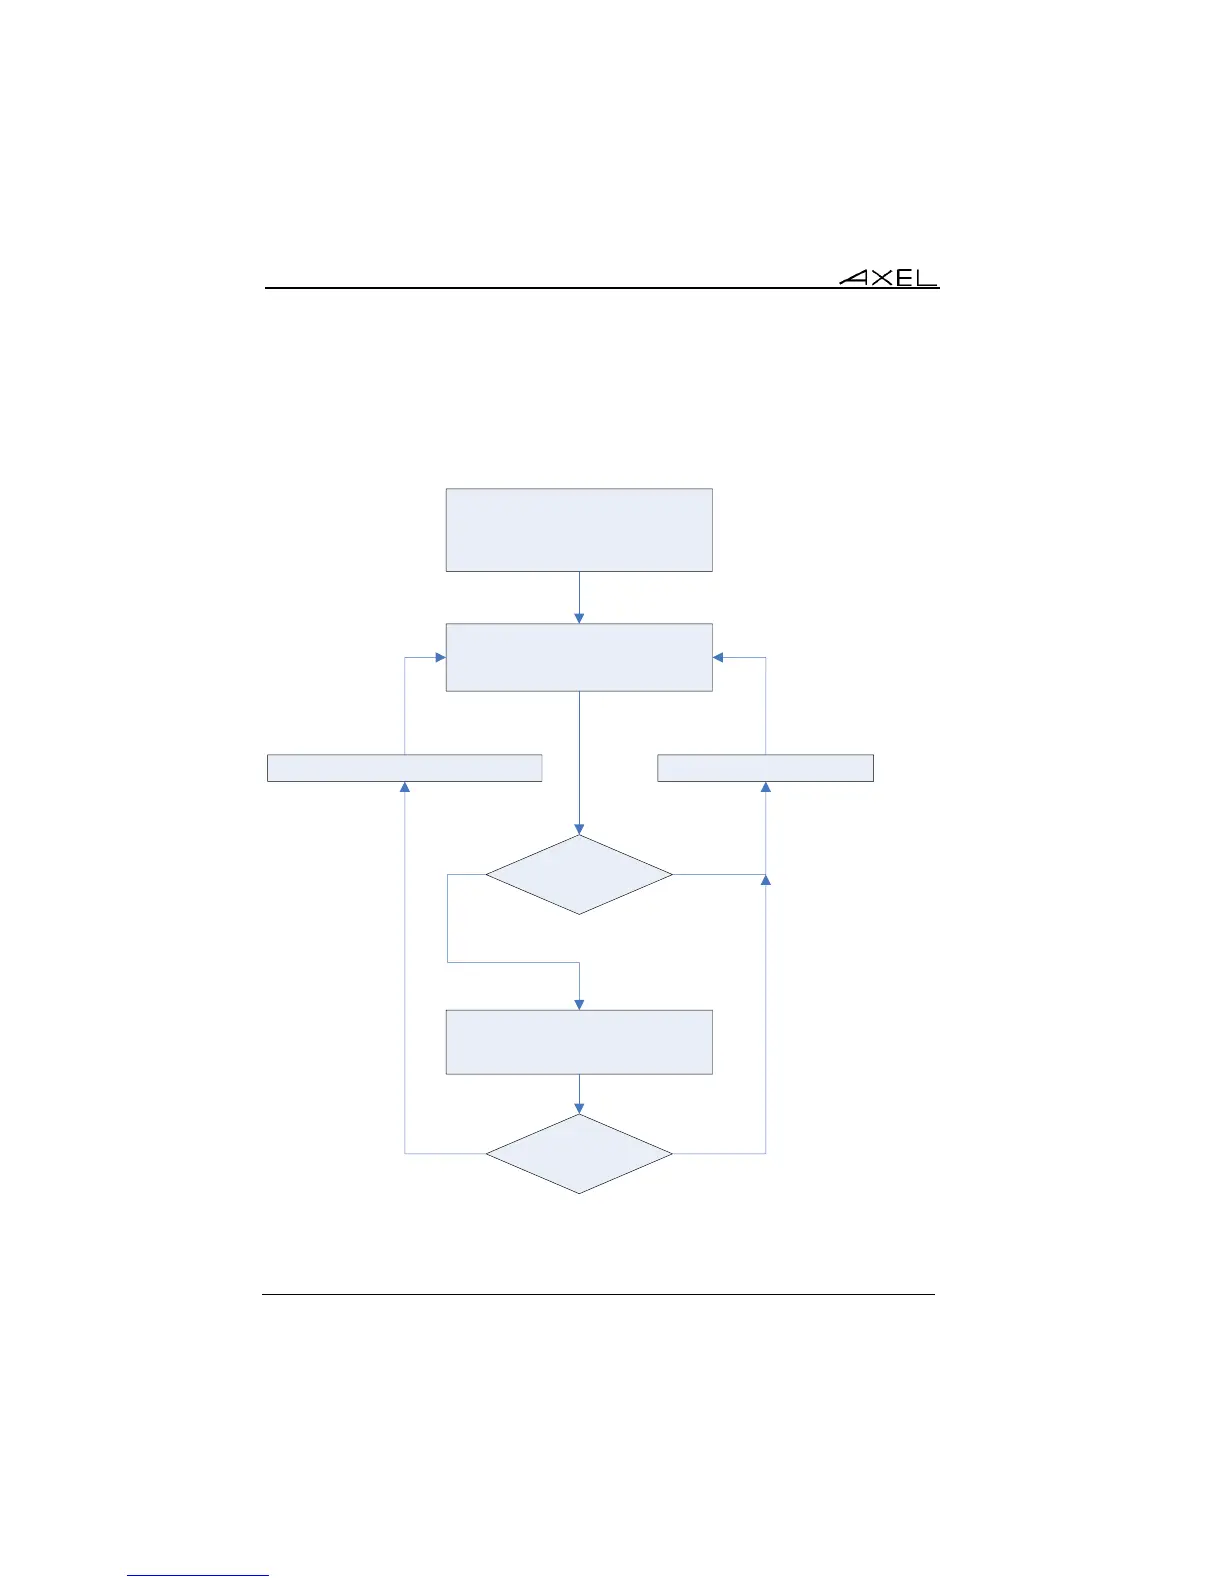
The following flow chart describes how the thin client computes the current
'Average RSSI'. This value computation is critical because a wireless
disconnection will be done if the Average RSSI is lower than the thin client RSSI
Threshold:
Initialisations:
N=Number of samples (initial)
Ts=Sampling Period
Th=RSSI Threshold before roaming
Average RSSI computation:
Sample RSSI «N» times using «Ts»
time between samples
Average RSSI < Th?
- Wireless disconnection
- Scan channels (200ms/channel)
- Connection to the 'best' AP
Same
BSSID AP ?
YES
N=Number of samples (fake roaming) N=Number of samples (initial)
NO
NOYES



 To Next Page