©2020 Baxter International Inc. 3- 19
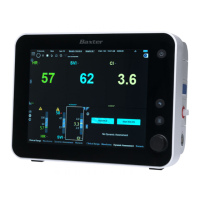
Home Screen
Real-time Values
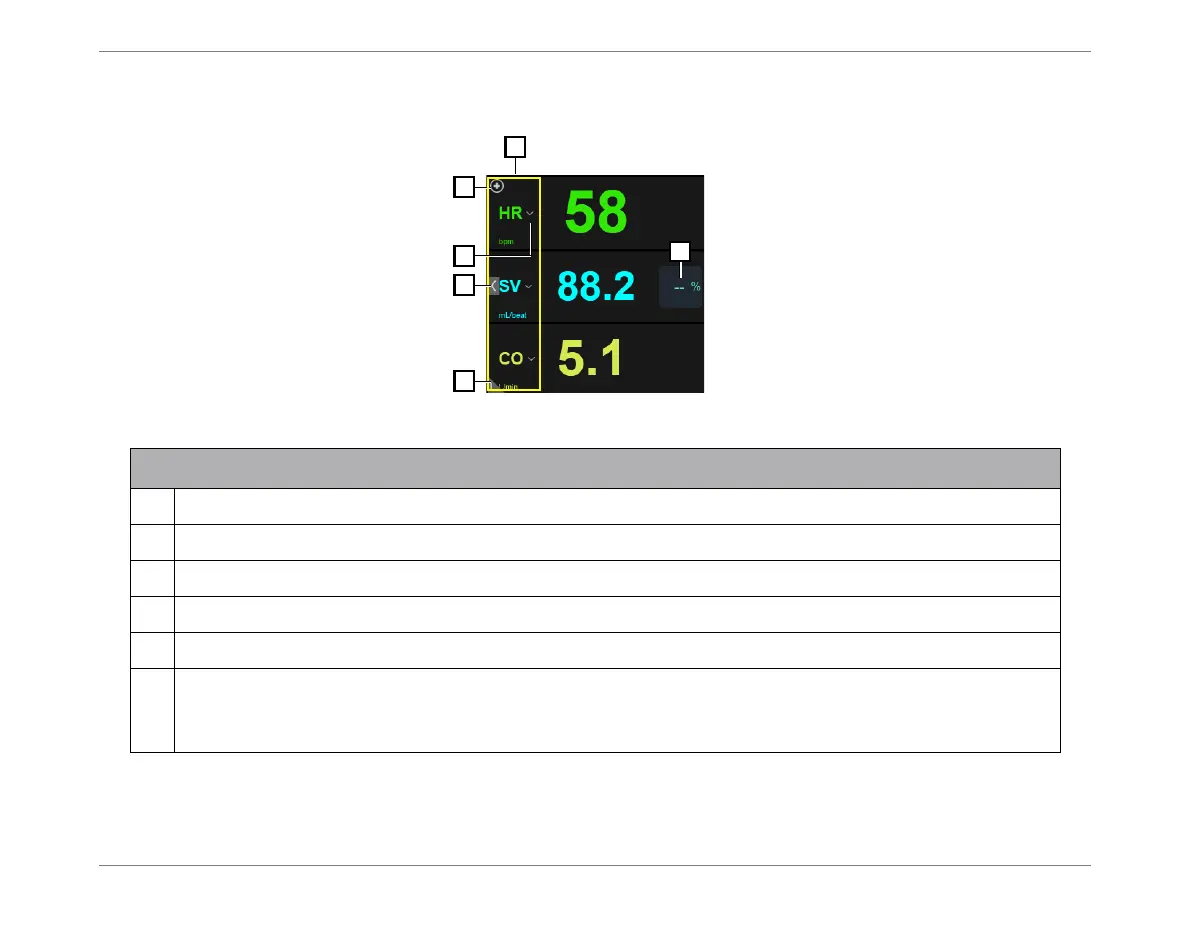
Figure 3-12 Real-time Values Area
Legend, Figure 3-12
1
Values area display controls (lists parameter values currently chosen for display).
2
Add a parameter to Values area (opens drop-down menu).
3
Remove or Replace a parameter (opens drop-down menu).
4
Expand/collapse full-width view - see Figure 3-13.
5
Expand/collapse full-screen view - Figure 3-14.
6
Area may show a percentage value and an
up
or
down
arrow, indicating the following:
Up arrow indicates a raised average SV/SVI (in comparison between the
current
average SV/SVI and
the
former
average SV/SVI); Down arrow indicates average SV/SVI is lowered.