©2020 Baxter International Inc. 3- 17
Home Screen
Trends Area Markers
The Starling system includes a feature whereby specific points of interest (in time), are marked
as part of the monitoring measurement values history.
Markers are added to the Trends display automatically whenever initiated manually by the
user. For example, when performing a Dynamic Assessment Test, pausing an active Monitoring
Session, or adding an Event.
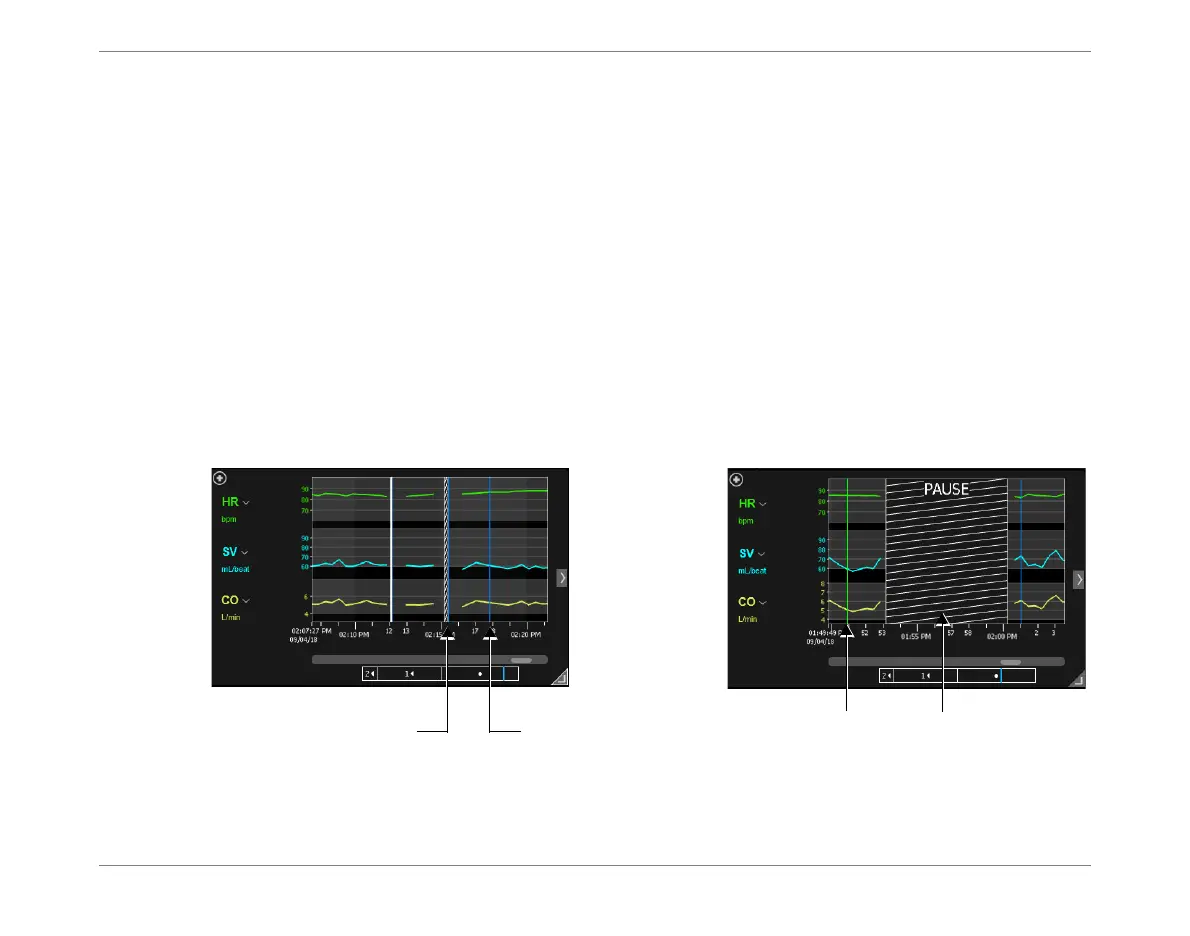
In the Trends area, Markers are shown as vertical lines superimposed on the graphs. For easy
identification, they are color-coded according to their type:
White -Pause (indicates Monitoring Session paused by the user).
A long pause is labeled within a band of angled stripes (see below).
Blue -Automatic Event (e.g., Dynamic Assessment Test performed).
Green -Manual Event (e.g., patient given medication, position changed,
etc
.)
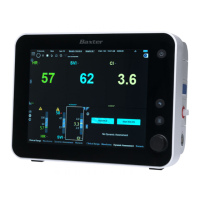
Figure 3-10 Trends Area Showing Markers
Pause Manual
Event
Long PauseDynamic Assessment
Test Performed