©2020 Baxter International Inc. 3- 11
Home Screen
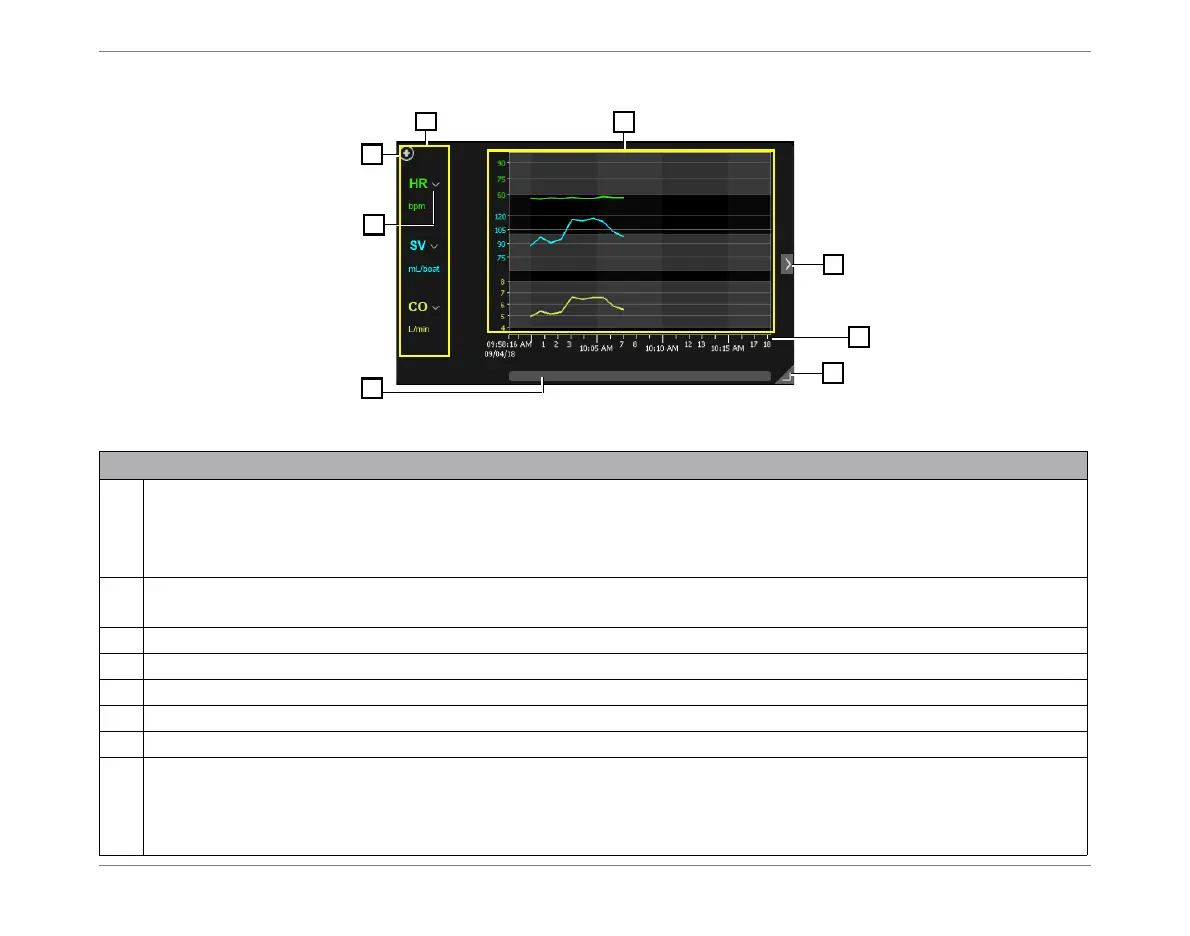
Trends Area
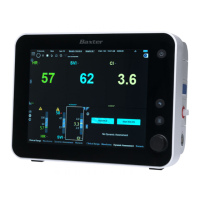
Figure 3-5 Trends Area
Legend, Figure 3-5
1
Scrollable display of Trend graphs of monitored and calculated results, displayed in permanent order. The
Trend graphs shown are only those for which values are currently selected for display. The display is
refreshed in accordance with the sampling rate option currently selected from the Controls toolbar
(see Figure 3-4). For scrolling options, see Viewing the Trends Display.
2
Trends display controls (lists parameters currently chosen for display).
See Controlling the Trends Display.
3
Add a parameter to Trend area (opens drop-down menu).
4
Remove or Replace a parameter.
5
Expand/collapse full-width view - see Figure 3-8.
6
Time line.
7
Expand/collapse full-screen view - see Figure 3-9.
8
Horizontal scrollbar. Note: If the selected patient has had more than one Monitoring Session performed in
the last 12 hours, the Session History button on the Controls Toolbar becomes enabled.
When Viewing Trends in History Mode (see page 3-34) the horizontal scrollbar, together with the Display
Control Knob, can be used to move easily through the Trends history.