©2020 Baxter International Inc. 5- 55
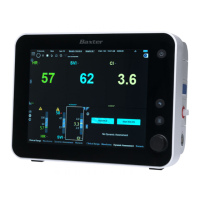
Performing a Dynamic Assessment Test
The displayed indicator color (red or green) remains for a period of 15 minutes after completion
of the Dynamic Assessment Test. Thereafter, the color changes to cyan and a new message
is displayed indicating the elapsed time since the last Test was performed, together with the
last result - refer to the examples in Figure 5-39 and Figure 5-48, respectively.
Note
If no Dynamic Assessment Tests have yet been performed on the selected patient, the window
displays the message No Dynamic Assessments, together with two buttons (
Start PLR
and
Start
Bolus
) ready for use, as applicable. Refer to Figure 3-18 on page 3-24.
Note
In Full Screen view, the user is able to view one or more Dynamic Assessment Test Results for a
single Monitoring Session, as later described.
However, for a patient who has undergone multiple Monitoring Sessions and Dynamic Assessment
Tests, the Results can be viewed easily by switching to History Mode.
Refer to Viewing Dynamic Assessment Test Results in History Mode on page 3-36.
Figure 5-51 Frank-Starling Curve - Interpretation of Stroke Volume Increase
Stroke Volume Increase >10%
Patient Considered to be FLUID RESPONSIVE
Stroke Volume Increase <10%
Patient Considered to be NOT FLUID RESPONSIVE
Switching the Dynamic Assessment display to full-screen view enables the user to review more detailed
Test Result information. This is described and explained in Dynamic Assessment Test Results in Full
Screen View on page 5-56