5-56 Starling Monitor - User Guide
Performing a Dynamic Assessment Test
Dynamic Assessment Test Results in Full Screen View
To View Dynamic Assessment Test Results in Full Screen View
1. Switch the Dynamic Assessment display to full-screen view (Figure 5-52).
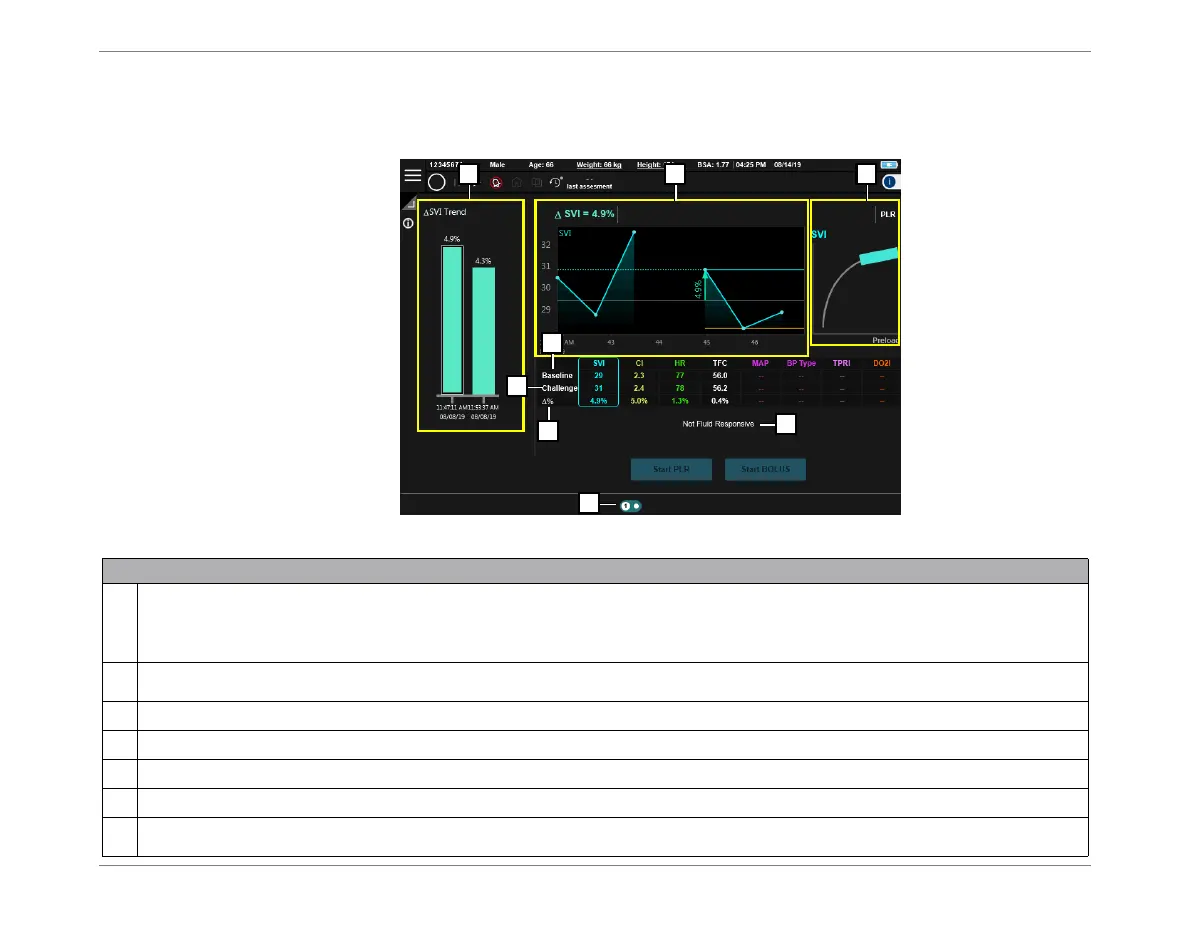
Figure 5-52 Dynamic Assessment Test Results - Full Screen View
Legend,Figure 5-52
1
SVI Trend - area displays SVI [%] results of up to 4 Dynamic Assessment Tests (each column represents one Test; the above example
shows two Tests). Corresponding to whichever column is currently in focus (in Figure 5-52, column on
left
) the continuous results of the
SVI during that Test are displayed in the area labeled [2] - see above.
Moving the focus from one column to another is explained in Step 3 on page 5-57.
2
Displays the continuous results of the SVI during the PLR/Bolus Test; this is divided into the Baseline portion, and the Challenge portion.
The tip of the arrow is pointing to the
maximum
point of the Challenge.
3
a
: Starling Curve -see explanations in Figure 5-50 on page 5-54;
b
: message indicating fluid responsiveness.
4
Baseline - indicates the average of each parameter during the Baseline measurement.
5
Challenge - indicates the maximum value of each parameter during the Challenge.
6
% - indicates the delta of each parameter.
7
Page Indicator - indicates how many Dynamic Assessment Tests were performed during the current Session. The example above shows
two (one currently displayed, plus one).