©2020 Baxter International Inc. 5- 51
Performing a Dynamic Assessment Test
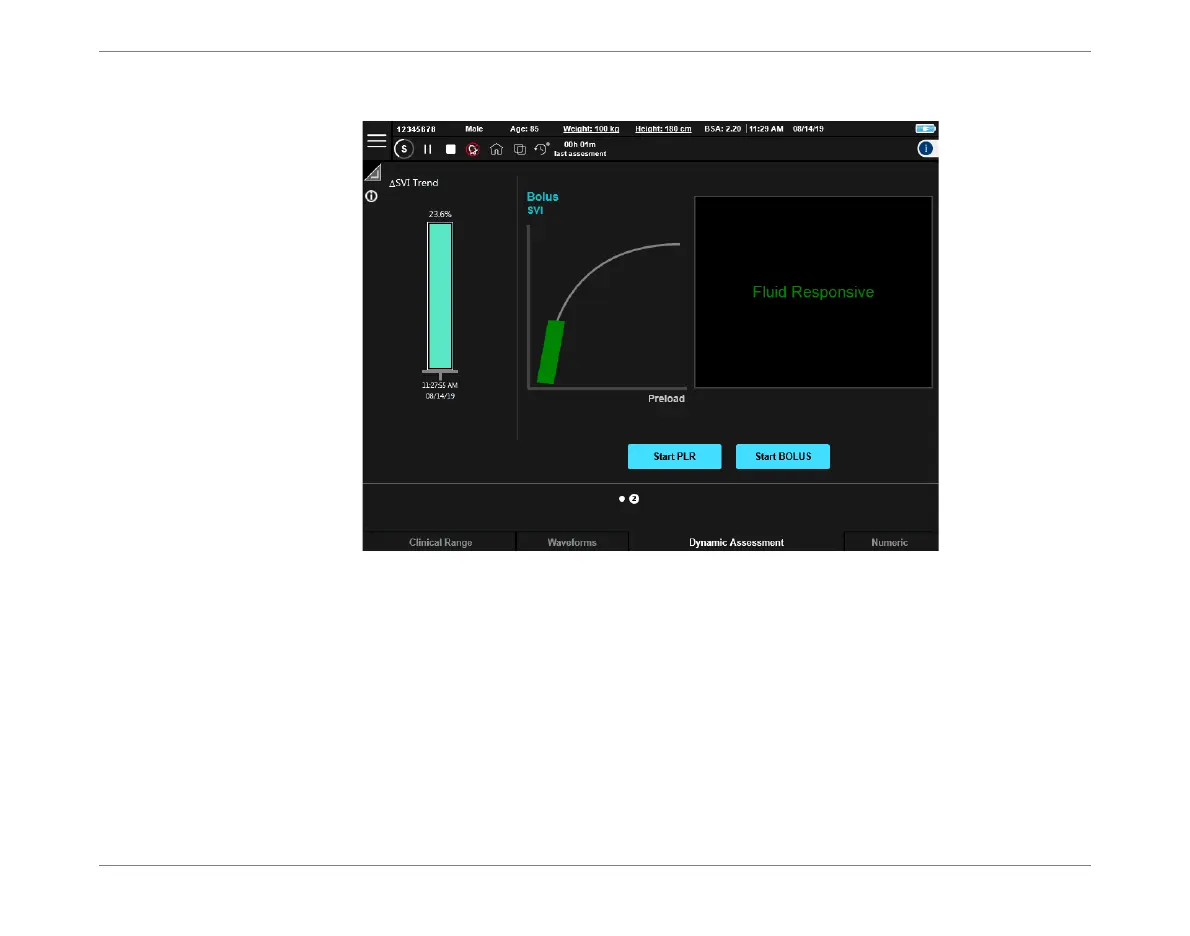
7. For an enlarged view of the displayed Bolus Test Results, switch the Display window to
full-screen view - Figure 5-47.
The Test Results display is presented as two pages; by default the display opens at Page 2
(Figure 5-47), showing a message and graphic representation of the patient’s fluid
responsiveness as determined by the Starling system.
Note
In the above example, the indicator on the Frank-Starling curve and corresponding message are
colored green (patient fluid responsive). However, if the Test Results indicated the patient was not
fluid responsive, these would be colored red.
The displayed color (green or red) remains for a period of 15 minutes after completion of the
Dynamic Assessment Test. Thereafter, the color changes to cyan and a new message is displayed
indicating the elapsed time since the last Test was performed, together with the last result - see
the example in Figure 5-48.
Figure 5-47 Viewing Bolus Test Results - Enlarged View Page 2